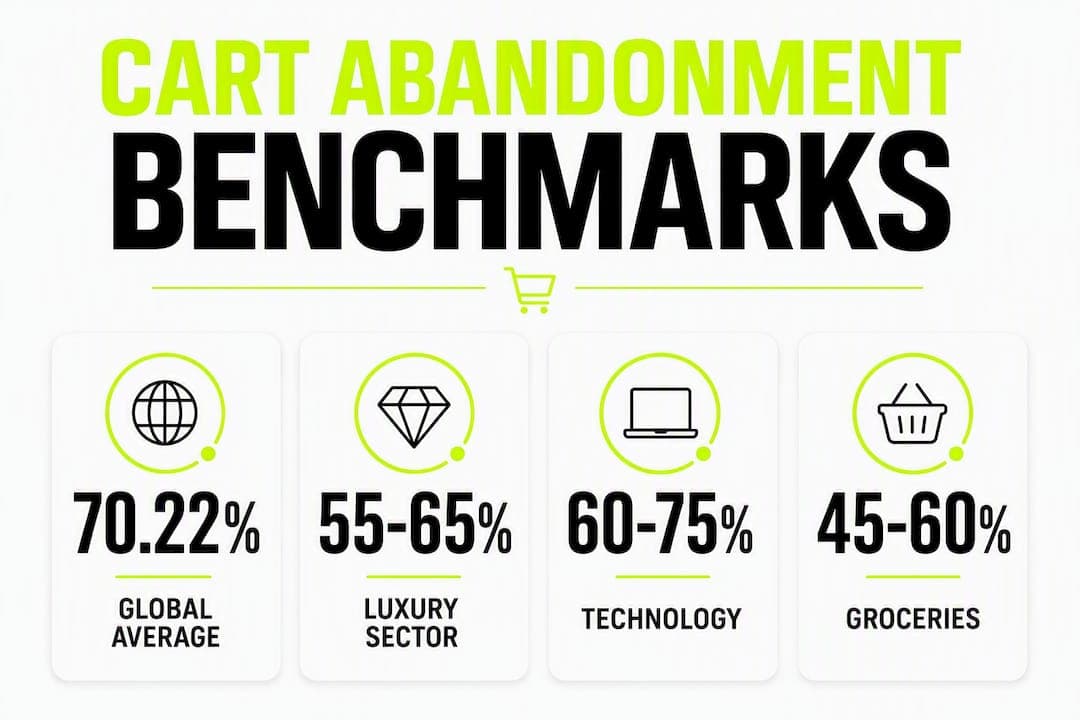
Your store’s cart abandonment rate is almost certainly sitting around 70.22 percent. That’s not a crisis unique to your business — Baymard’s meta-analysis of 50 studies puts the global average at 70.22%, and it has barely budged in over a decade. The good news: a meaningful portion of that revenue is recoverable, and three fixes move the needle faster than anything else.
Three immediate actions worth starting today:
-
Show all costs before checkout. Unexpected extra costs — shipping, taxes, and fees revealed late in the funnel — drive a substantial portion of non-browsing abandonments. Surface them on the product page or cart page, not at payment.
-
Cut checkout friction. Enable guest checkout, reduce required form fields, and add the payment methods your customers actually use. Checkout UX improvements routinely produce double-digit conversion lifts.
-
Launch a coordinated recovery sequence. A single abandoned cart email recovers less than coordinated multi-channel sequences. Build at least a two-touch flow across email, SMS, or push.
Stat to bookmark: The documented global average sits at 70.22%, with unexpected costs cited in roughly 39% of abandonment cases.
Table of Contents
-
What is the cart abandonment rate and how do you calculate it?
-
How does your abandonment rate compare to industry benchmarks?
-
How should you measure cart abandonment and which KPIs matter?
-
What are the highest-ROI tactics to reduce cart abandonment?
What is the cart abandonment rate and how do you calculate it?
Cart abandonment rate (CAR) measures the share of shoppers who add items to their cart but leave without completing a purchase. It is the single most-watched conversion metric in e-commerce because it sits right at the edge of a sale.
The standard formula:
-
Count the number of completed purchases in a given period.
-
Count the number of sessions where a cart was initiated (items added).
-
Apply: CAR = (1 − Purchases ÷ Carts Initiated) × 100
Some teams use “checkout started” as the denominator instead of “cart initiated.” That choice matters. Using checkout-started produces a lower, more optimistic rate because it excludes shoppers who never reached checkout at all. Using cart-initiated captures the full funnel drop-off. Pick one and stick with it — mixing denominators across reports creates false trend lines.
Worked example: Your store records 1,000 cart initiations in a week. 300 result in completed orders. CAR = (1 − 300 ÷ 1,000) × 100 = 70.22% (global average).
Pro Tip: Set a consistent attribution window before you start tracking. A 7-day window is the most common standard and aligns well with most analytics platforms. Shorter windows undercount multi-session journeys; longer ones inflate recovery attribution.
How does your abandonment rate compare to industry benchmarks?
The 70.22% meta-average from Baymard is the most-cited benchmark in the industry, and for good reason: it aggregates 50 independent studies, which smooths out the noise from any single data source. Live trackers, by contrast, can read higher, reflecting real-time variance in traffic quality and seasonal swings. Neither number is wrong; they measure slightly different things.
Industry and device breakdown
| Segment | Approximate CAR range |
|---|---|
| Global meta-average (Baymard, 50 studies) | 70.22% |
| Luxury / large-ticket retail has higher abandonment rates | |
| Fashion and apparel experiences abandonment rates near the industry average | |
| Consumer electronics typically sees relatively high abandonment rates | |
| Grocery / subscription categories usually have somewhat lower abandonment rates | |
| Travel and hospitality sectors often exhibit very high abandonment rates |
Device splits tell an equally important story:
| Device | Typical CAR |
|---|---|
| Desktop typically shows somewhat lower abandonment rates | |
| Tablet devices tend to have abandonment rates similar to the average | |
| Mobile devices experience higher abandonment rates compared to desktop |
Mobile abandonment runs consistently higher than desktop, primarily because checkout forms are harder to complete on small screens and payment friction is greater. If your mobile CAR is more than 10 percentage points above your desktop rate, that gap is your first optimization target.
Benchmark reality check: A 70% rate is not a failure — it is the baseline. The goal is not to reach zero; it is to close the gap between your rate and the lower end of your industry range, then recover a portion of what remains.
Why do shoppers actually abandon their carts?
The causes are well-documented, and they cluster around a handful of fixable problems. Prioritize by frequency and ease of fix.
-
Unexpected extra costs (shipping, taxes, fees): The leading cause, cited in a significant portion of abandonment cases. Shoppers build a mental price in their head while browsing; a surprise at checkout breaks that commitment.
-
Forced account creation: Requiring registration before purchase is a conversion killer, especially for first-time visitors. Guest checkout removes this barrier entirely.
-
Long or complex checkout: Too many steps, too many required fields, confusing form layouts. Every additional field is a micro-friction point.
-
Poor mobile UX: Small tap targets, non-optimized keyboards for numeric fields, and slow load times all push mobile shoppers away.
-
Limited payment options: If your preferred payment method is not listed, you leave. Buy Now Pay Later (BNPL) options like Affirm and Klarna have become expected in many categories.
-
Slow page load speed: A one-second delay in page response can meaningfully reduce conversions. Compress images, use a CDN, and audit your third-party scripts.
-
Unclear return policy: Shoppers buying online cannot touch the product. A clear, easy-to-find return policy reduces perceived risk.
-
Price comparison behavior: Some abandonment is deliberate research behavior — shoppers saving carts to compare across stores. Recovery sequences can recapture these shoppers when they return.
Stat: Checkout UX improvements and price transparency changes can produce double-digit conversion lifts for sessions that reach checkout — making it the highest-ROI place to start.
What does cart abandonment actually cost your business?
The revenue math is straightforward and usually sobering. If your store generates $2 million in annual revenue and your CAR is 70%, the implied value of abandoned carts is roughly $4.7 million — meaning you’re converting less than a third of available cart value. Even recovering 10–15% of that abandoned revenue would add hundreds of thousands of dollars without acquiring a single new customer.
Recovery programs also affect your customer acquisition cost (CAC). Recovering revenue from existing sessions is typically more cost-effective than acquiring new customers. Brands without a recovery program are effectively paying full acquisition cost for every conversion, while competitors with multi-channel sequences are extracting more value from the same traffic.
| Scenario | Assumed CAR | Annual revenue | Implied abandoned value | Recovery at 10% |
|---|---|---|---|---|
| Small store | 70.22% | — | — | — |
| Mid-market | 70.22% | $2M | $4.7 million | — |
| Growth brand | 70.22% | $10M | — | — |
Multi-channel recovery programs recover a materially larger share of abandoned carts than single-email setups. That gap compounds quickly at scale.
How should you measure cart abandonment and which KPIs matter?
Tracking CAR alone gives you a headline, not a diagnosis. Build a measurement stack around these KPIs:
-
Cart abandonment rate (your primary metric, calculated consistently as above)
-
Checkout conversion rate (purchases ÷ checkout-started sessions)
-
Checkout funnel drop-off by step (which field or page loses the most sessions)
-
Recovered revenue (attributed to recovery sequences, by channel)
-
Revenue per abandoned cart (total abandoned cart value ÷ number of abandoned carts)
-
Recovery rate by channel (email, SMS, push — separately)
-
Device-specific CAR (mobile vs. desktop, as above)
For event setup, define these four events in your analytics platform: cart_added, checkout_started, checkout_completed, and order_confirmed. Server-side event firing is more reliable than client-side for checkout events, where ad blockers and browser restrictions can cause undercounting.
Report CAR weekly for operational decisions and monthly for trend analysis. A single-week spike is often a traffic-quality issue; a multi-week trend signals a structural problem.
Pro Tip: Multi-session and cross-device journeys are routinely undercounted. A shopper who adds to cart on mobile and completes on desktop may appear as two separate sessions. Use a persistent user identifier (logged-in account or hashed email) where available, and apply a 7-day attribution window to your recovery platform to capture these journeys.
What are the highest-ROI tactics to reduce cart abandonment?
Start with structural fixes before layering on recovery channels. Fixing the leak is cheaper than mopping the floor.
Structural fixes first
-
Show shipping costs and taxes on the product page or in a persistent cart summary — not for the first time at payment.
-
Enable guest checkout. Make account creation optional and post-purchase.
-
Reduce checkout to the fewest possible steps. Three pages or fewer is the target; one-page checkout is worth testing.
-
Add the payment methods your customer base uses: major credit cards, PayPal, Apple Pay, Google Pay, and at least one BNPL option.
-
Compress all images and audit third-party scripts. Use Google PageSpeed Insights or WebPageTest to identify load-time offenders.
Recovery and persuasion layer
-
Add product-specific trust signals at checkout: security badges, return policy summary, and estimated delivery date.
-
Use exit-intent overlays on the cart page to capture email addresses before shoppers leave — but keep the ask minimal (email only, no phone required).
-
Display the exact product image from the shopper’s cart in every recovery message. Using the exact cart product image in notifications and emails can boost conversion by 11–17% versus generic product photos.
-
Make the return-to-cart link in recovery messages a single click, pre-populated with the original cart contents.
-
Add micro-commitment cues: “Only 3 left in stock” or “Ships today if ordered by 3 PM” where genuinely true.
Pro Tip: Reserve discounts for price-sensitive segments — typically first-time visitors and shoppers who browsed multiple price points. Sending a discount to every abandoner trains shoppers to abandon intentionally and wait for the coupon. Use clean, product-focused reminders first; introduce a discount only in a later message if the shopper still hasn’t converted.
Quick implementation checklist
-
[ ] Audit checkout for surprise costs (test as a new visitor)
-
[ ] Enable guest checkout if not already active
-
[ ] Reduce required fields to name, email, shipping address, payment
-
[ ] Verify mobile checkout on iOS Safari and Android Chrome
-
[ ] Set up funnel drop-off reporting by step in your analytics platform
-
[ ] Configure at least a two-touch recovery sequence
Which recovery channels and sequences convert best?
Recovery is where you recapture intent that already exists. The channel mix matters as much as the message.
Email remains the workhorse. A well-optimized email sequence recovers 5–15% of abandoned, with top performers reaching 20%+. Timing matters: send the first message within 1–4 hours of abandonment, while the product is still top of mind. A second message at 24 hours and a third at 72 hours (with a discount, if your segmentation warrants it) is a proven structure.
SMS reaches a different slice of your audience. Recovery rates run 3–8% of abandoners reached, but open rates are dramatically higher than email. Keep SMS messages short, include the product name, and send within one hour of abandonment. Compliance with TCPA regulations is non-negotiable for US-based stores.
Push notifications solve a problem email and SMS cannot: they reach anonymous visitors who never supplied contact details. Most e-commerce stores have no recovery channel for this group, which often represents the majority of their traffic. Push-based approaches using App Clips can deliver lock-screen notifications to these shoppers without requiring an app install or prior data collection.
Retargeting ads (paid social and display) typically recover 2–5% of abandoners reached and work best as a supporting channel rather than a primary one.
Recommended sequence structure
-
Hour 1: Push notification (anonymous visitors) or SMS (opted-in contacts) — product image, single CTA, no discount
-
Hour 1–4: Email #1 — product image, cart summary, return-to-cart link, no discount
-
Hour 24: Email #2 — social proof (reviews), urgency cue if genuine, still no discount
-
Hour 72: Email #3 — discount offer for price-sensitive segment only; clean reminder for repeat/high-intent visitors
Avoid fake countdown timers and manufactured urgency. Low-pressure, personalized messages focused on the specific product consistently outperform “urgency theater” in long-run testing.
For a deeper look at how browse abandonment differs from cart abandonment and how to sequence recovery for each, the distinction matters more than most teams realize.
How do you test changes and prove what actually works?
Every checkout change should be tested before it is rolled out. Intuition is a starting point, not a verdict.
A/B testing checklist:
-
Write a hypothesis. “Showing shipping cost on the product page will reduce CAR by X because it removes the surprise at checkout.”
-
Choose one primary metric. Checkout conversion rate or revenue per session — not CAR alone, which can be gamed by traffic quality changes.
-
Calculate required sample size before you start. Use a tool like Evan Miller’s sample size calculator. Most checkout tests need at least 1,000 sessions per variant to reach 95% confidence.
-
Set a minimum test duration. Run for at least two full business cycles (typically two weeks) to account for day-of-week variance.
-
Segment your results. A change that lifts desktop conversion may hurt mobile. Always break results down by device.
-
Define guardrails. If revenue per session drops more than 5% in either variant, pause the test.
-
Prioritize tests by expected impact multiplied by confidence in the hypothesis — not by ease of implementation.
-
Run one test at a time on the checkout flow. Concurrent tests on the same funnel produce uninterpretable results.
-
Document every test, including failures. A negative result is data.
Pro Tip: For recovery-channel experiments, use holdout groups rather than A/B splits. Send your recovery sequence to 80% of abandoners and hold back 20% as a control. The revenue difference between the two groups is your true recovery uplift — and it avoids the double-counting problem that plagues last-click attribution.
Ten quick wins you can ship this week
No long projects. These are changes that typically require one sprint or less.
-
Show shipping cost earlier. Add a shipping estimator to the cart page or product page.
-
Enable guest checkout. If your platform supports it, this is a same-day change.
-
Remove unnecessary fields. Audit your checkout form and delete any field that is not required to fulfill the order.
-
Add product images to cart recovery emails. Most email platforms support dynamic product image blocks.
-
Compress images site-wide. Use a tool like Squoosh or your CDN’s image optimization to cut load times.
-
Send a one-hour push or SMS reminder. Set up a single-message automation triggered by cart abandonment with a 60-minute delay.
-
Fix mobile form UX. Set
inputmode="numeric"on phone and zip code fields so the right keyboard appears on iOS and Android. -
Add a return policy link in the cart. One sentence and a link is enough to reduce perceived risk.
-
Verify payment gateway error messages. Test a declined card scenario and confirm the error message tells the shopper what to do next.
-
Run a one-week pre/post measurement. Pick one change, record your baseline CAR for the week before, ship the change, and measure the week after. Imperfect but fast.
Pro Tip: Push your discount offer to the third touch in your recovery sequence, not the first. Shoppers who convert on a clean reminder (no discount) protect your margin. Those who need a nudge get one — but only after you’ve confirmed they won’t convert without it.
Key Takeaways
The most effective approach to reducing cart abandonment is fixing checkout friction first, then layering a multi-channel recovery sequence to recapture the intent you couldn’t prevent from leaving.
| Point | Details |
|---|---|
| Baseline benchmark | The global meta-average CAR is 70.22%; treat anything above your industry range as a priority fix. |
| Top fixable cause | Unexpected extra costs drive a large share of abandonment; show all fees before checkout to address this directly. |
| Recovery channel gap | Multi-channel sequences recover 12–18% of abandoned carts; single-email flows recover 4–7%. |
| Test before you scale | Run A/B tests with at least 1,000 sessions per variant and use holdout groups for recovery-channel experiments. |
| Storepush for anonymous traffic | Storepush re-engages anonymous visitors via iOS App Clips push notifications without requiring email or phone collection. |
The discount trap is the real abandonment problem
Most teams I see approach cart abandonment backwards. They build the recovery email first, add a 10% discount to make it “convert,” and call it a program. Then they wonder why their margin is eroding and their abandonment rate hasn’t moved.
The real leverage is upstream. Checkout friction and surprise costs are responsible for the majority of preventable abandonment, and fixing them costs nothing in margin. A guest checkout toggle and a shipping cost estimator on the product page will outperform a discount email for most stores — and they do it permanently, not just for the shoppers who happened to get the coupon.
Recovery sequences matter, but their job is to recapture intent that genuinely left, not to compensate for a broken checkout. And the channel mix matters more than most teams realize. Email reaches opted-in contacts. SMS reaches a slightly different slice. Neither reaches the anonymous majority who browsed, added to cart, and walked away without ever giving you their information. That group is where push notifications earn their place — not as a replacement for email, but as the only channel that can reach visitors you otherwise have no way to follow up with.
The brands that consistently outperform their category benchmarks do three things: they fix the structural causes first, they run disciplined tests instead of guessing, and they build recovery sequences that match the right message to the right channel at the right time. The discount is a last resort, not a strategy.
Storepush reaches the shoppers your other channels miss
Most recovery programs stop at email and SMS — which means they only reach the fraction of abandoners who opted in. The majority of your traffic walks away anonymous, and those shoppers are simply gone with a traditional setup.
Storepush changes that equation. Using native iOS App Clips, it delivers push notifications directly to shoppers’ lock screens without requiring an email address, phone number, or app install. That means you can re-engage the 90%+ of visitors who leave without purchasing — the ones your email sequence never sees. It integrates with Shopify, WooCommerce, BigCommerce, and custom storefronts, and the dashboard gives you revenue attribution, funnel tracking, and CTR heatmaps so you can measure exactly what it recovers.
If your anonymous-visitor traffic is high and your other recovery channels are hitting diminishing returns, push is worth testing as the first touch in your sequence. Book a demo to see how it fits your store’s setup, or explore the full feature set at storepush.io.
Useful sources and further reading
The benchmarks and tactics in this article draw from the following primary sources. When comparing your internal data to industry figures, align your calculation method to the source’s methodology first.
-
Baymard Institute — Cart Abandonment Rate (meta-analysis of 50 studies)
-
Statista — Global digital shopping cart abandonment rate series
-
PropelCommerce — Average cart abandonment rate 2026
-
Ecommerce Times — How to build an abandoned cart recovery system
-
Furlough — Cart abandonment recovery: the complete e-commerce playbook
-
Cartflows — 65+ cart and checkout abandonment statistics