
Instrument a minimal, event-based funnel as your authoritative source of truth, then layer analytics and alerts on top. That's the whole strategy, and everything else in funnel tracking ecommerce operations is just execution detail. If your funnel data doesn't match what finance sees in the order system, no dashboard, cohort chart, or attribution model will save you.
Before you build anything elaborate, check whether your current setup covers the basics; for a handy reference, see the July Website Checklist: Turn Summer Traffic Into Enquiries from No Worry Websites & Ai Automations. Most funnel tracking failures don't come from missing sophistication. They come from missing fundamentals.
Here's your non-negotiable checklist:
- Six core events, minimum:
session_start,product_viewed,add_to_cart,checkout_started,payment_info_submitted,order_completed - Four required properties on every commerce event:
product_id,value,currency,quantity - One unique
order_idper transaction, used consistently across client and server events for deduplication - A server-side purchase event that doesn't depend on the browser sticking around after checkout
Pro Tip: If you can't answer "how many orders did we process yesterday, tracked vs. actual" within five minutes, you don't have a funnel problem yet. You have a data trust problem, and it needs to get fixed before you touch conversion optimization.
If your setup already checks those four boxes, skip ahead to the segmentation and attribution sections. If it doesn't, start with the instrumentation playbook below before you spend another dollar on traffic.
Key Takeaways
Reliable funnel tracking in ecommerce depends on a minimal, locked event schema, server-side revenue as the source of truth, and a weekly reconciliation habit that catches drift before it corrupts your reporting.
| Point | Details |
|---|---|
| Verify the six core events | Confirm session_start, product_viewed, add_to_cart, checkout_started, payment_info_submitted, and order_completed all fire correctly. |
| Run a reconciliation this week | Compare tracked order_completed events against your order management system's actual order count. |
| Lock your schema and set alerts | Version-control event names and properties, then set an alert threshold for large funnel percentage shifts. |
| Pair numbers with qualitative tools | Use session replay or surveys alongside drop-off data to understand the actual cause, not just the size of the leak. |
| Add a recovery layer for drop-off | StorePush re-engages cart and browse abandoners via push notifications without requiring emails or phone numbers. |
Table of Contents
- What Is an Ecommerce Conversion Funnel?
- What Are the Standard Ecommerce Funnel Steps?
- What KPIs Should You Track in a Sales Funnel?
- How Do You Instrument Funnel Tracking Reliably?
- How Do You Segment and Analyze Funnel Data?
- Which Tools Should You Use for Funnel Tracking?
- Why Do Funnel Numbers Suddenly Look Wrong?
- What Should Your Instrumentation Checklist Look Like?
- What I'd Prioritize If I Were Rebuilding a Funnel From Scratch
- How Does StorePush Fit Into Your Funnel Strategy?
- What Are the Best Resources for Learning Ecommerce Funnel Tracking?
- Frequently Asked Questions
- Sources
What Is an Ecommerce Conversion Funnel?
An ecommerce conversion funnel is the sequence of steps a shopper moves through between landing on your store and completing a purchase. You track it to find where people drop off, then prioritize fixes based on where the biggest proportional loss happens. BigCommerce's purchase funnel report frames this with four steps: Visited, Shopped, Added to Cart, Purchased, and calculates conversion rate as 100 times eligible storefront orders divided by visits. That's the textbook version. In practice, most teams need a slightly more granular model to catch checkout-specific friction.
The concept has roots in traditional marketing funnels, which Wikipedia's overview of the purchase funnel traces back to awareness-to-purchase models used long before ecommerce existed. What's changed is the precision available. You're no longer estimating stages from surveys. You're measuring exact drop-off percentages between defined events.
Not every funnel should be modeled the same way, though. There are three structural choices that matter:
Sequential funnels require users to hit each step in order, but they don't enforce a strict timeframe. A shopper who views a product on Monday and completes checkout on Thursday still counts.
Strict (closed) funnels enforce both order and continuity. If a user skips a step or the sequence breaks, they drop out of the funnel entirely. Plausible's funnel documentation describes this distinction directly, noting that funnels default to sequential mode and can accept both pageview and custom event goals.
Open and trended funnels don't require the same rigid path. They're better suited to cross-session behavior, where a shopper adds to cart on their phone during a commute and finishes the purchase on a laptop that evening. Google Analytics documentation on open versus closed funnel behavior confirms this pattern is common enough that treating every funnel as strict will systematically undercount real conversions.
Use strict funnels for your checkout flow, where step order genuinely matters and you want to catch exactly where friction lives. Use open or sequential funnels for the broader browse-to-purchase journey, where session boundaries are artificial and shoppers routinely return days later.
Pro Tip: Run a hybrid model. Keep a tightly closed funnel just for checkout (add_payment_info through order_completed) so you can pinpoint exact abandonment points. Layer a separate open funnel over the full browse-to-purchase journey to capture the shoppers who leave and come back on a different device three days later.
What Are the Standard Ecommerce Funnel Steps?
Most storefronts can be measured accurately with six events. According to guidance from FunnelAnalytics' ecommerce funnel guide, this minimal set covers roughly 95% of what a standard online store needs for meaningful analysis. Anything beyond that six-event core is usually diagnostic detail, not foundational tracking.
Here's the canonical sequence and why each step earns its place:
session_start— establishes your denominator for every conversion rate you'll calculateproduct_viewed— shows intent and lets you segment by which products drive the most funnel entriesadd_to_cart— the first hard signal of purchase interest, and the step most teams over-index oncheckout_started— separates "browsing with intent" from "committed to buying"payment_info_submitted— catches the exact moment friction from payment forms, security warnings, or unexpected fees causes people to bailorder_completed— your revenue source of truth, ideally fired server-side
For a checkout-specific view, Google's ecommerce exploration documentation recommends steps like begin_checkout, add_shipping_info, add_payment_info, and purchase, which map closely onto the same logic with slightly different naming conventions depending on platform.
Here's what a minimal event payload should look like in practice:
{
  "event": "add_to_cart",
  "product_id": "SKU-4821",
  "value": 48.00,
  "currency": "USD",
  "quantity": 1,
  "user_id": "anon-8f3a2b1c",
  "timestamp": "2026-03-04T14:22:01Z"
}
That structure translates directly into a Google Tag Manager data layer push or a server-side webhook payload, depending on your architecture. The property names matter less than consistency. Pick one convention and never deviate.
| Rule | Why it matters |
|---|---|
| Use snake_case for all event and property names | Prevents mismatched fields across platforms and integrations |
One canonical order_id per transaction | Enables deduplication across client and server events |
| Server-generated timestamps for revenue events | Removes client clock drift and timezone inconsistencies |
| Fixed schema, version-controlled | Stops silent property drift that breaks historical comparisons |
Pro Tip: Lock your event schema in code before your first campaign launch, not after. Retroactively fixing three months of inconsistent product_id formatting is a miserable, avoidable weekend.
What KPIs Should You Track in a Sales Funnel?
Eight metrics cover almost everything you need to diagnose funnel health. Each has a formula, and each answers a slightly different question.
Funnel conversion rate: (orders completed / total sessions) × 100. This is your headline number, but it hides everything useful.
Step conversion rate: (users completing step N / users completing step N-1) × 100. This is where the real diagnostic value lives, because it isolates exactly which transition is leaking the most people.
Drop-off rate: 100 minus the step conversion rate. Same math, framed as loss instead of gain, which is often easier to prioritize by.
Cart abandonment rate: (carts created without a completed order / total carts created) × 100.
Checkout abandonment rate: same formula, but scoped narrowly to sessions that already reached checkout_started. This is a more actionable number than cart abandonment because it isolates payment and shipping friction from earlier browsing hesitation.
Average order value (AOV): total revenue / number of orders.
Revenue per visitor (RPV): total revenue / total sessions. This one matters more than raw conversion rate for prioritization, because it accounts for both conversion frequency and order size.
Lifetime value (LTV): average order value × average purchase frequency × average customer lifespan.
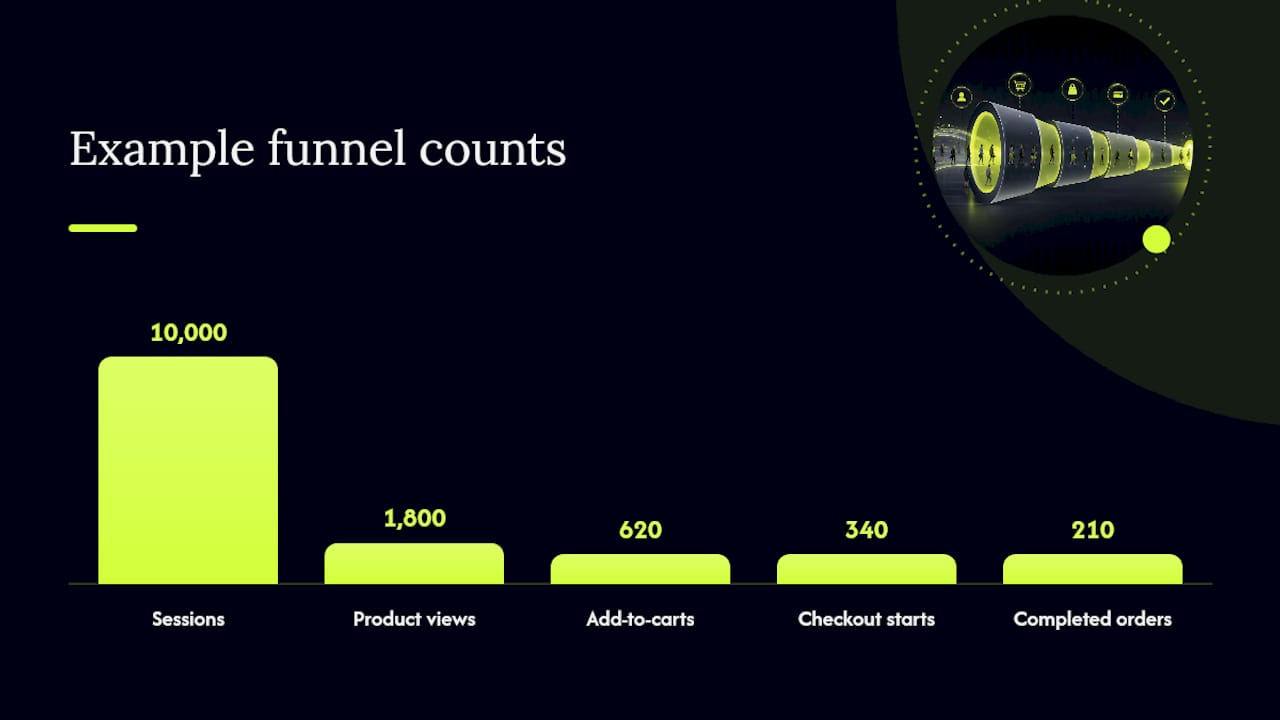
Here's a worked example using round numbers. Say your store had 10,000 sessions last week, with 1,800 product views converting to 620 add-to-carts, 340 checkout starts, and 210 completed orders.
| KPI | Formula | Quick diagnostic use |
|---|---|---|
| Step conversion rate | Step N users / Step N-1 users × 100 | Finds the single largest leak point |
| Cart abandonment rate | 1 minus (orders / carts created) | Flags early-stage friction or price shock |
| Checkout abandonment rate | 1 minus (orders / checkout starts) | Isolates payment/shipping-specific problems |
| Revenue per visitor | Total revenue / total sessions | Prioritizes traffic quality over raw conversion count |
| Average order value | Total revenue / number of orders | Signals whether upsell or bundling tactics are working |
Track step conversion rates and drop-off daily, since those move fast and reveal deployment issues quickly. Check AOV and RPV weekly. Review LTV monthly, since it needs a longer window to stabilize. If you can only fix one thing this quarter, fix the step with the largest proportional drop, not the step with the largest absolute number of lost users. Percentages, not raw counts, tell you where the real leverage is. For a deeper look at why conversion-rate optimization should focus beyond the add-to-cart moment, see this breakdown of CRO priorities for ecommerce.
How Do You Instrument Funnel Tracking Reliably?
Data flows through four layers: client-side events fire from the browser, a tag manager routes and enriches them, a server-side proxy or webhook validates and forwards them, and analytics destinations plus your data warehouse receive the final record. Each layer is a place where things can silently break, which is why a checklist approach beats improvising as you go.
- Define your canonical event list first, on paper, before writing any code. Six to ten events is usually enough.
- Lock the schema in version control. Treat event names and properties like an API contract, not a suggestion.
- Implement client-side events for behavioral context: page views, scroll depth, product interactions, and add-to-cart clicks.
- Implement server-side events for anything tied to revenue. Purchase confirmation should never depend solely on a client-side pixel firing correctly.
- Build your deduplication strategy around
order_id. Every purchase event, client or server, carries the same identifier so downstream systems can collapse duplicates. - Handle consent state explicitly. Decide what fires before consent, what fires after, and document the difference so your funnel numbers don't quietly shift when a cookie banner update rolls out.
- Export to your warehouse on a schedule you can audit, not just to a dashboard tool that obscures raw records.
For Shopify-specific implementation quirks, including theme-level tracking gaps and checkout extensibility limits, this Shopify conversion optimization guide covers platform-native workarounds worth knowing before you start.
QA doesn't end at launch. Run smoke tests on every deploy that touches checkout markup. Schedule a weekly reconciliation that compares tracked order_completed events against your actual order management system record count. Add CI-level schema validation so a rogue property name doesn't slip into production. And specifically test for back-forward cache (bfcache) behavior and thank-you page refreshes, both of which are notorious for double-firing purchase events or, worse, firing zero events when a user hits the back button after a completed order.
Pro Tip: Treat server-side events as your authoritative revenue record and client-side events as behavioral context only. Ad blockers, Safari's Intelligent Tracking Prevention, and browser privacy settings routinely strip client-side pixels, but a server-to-server webhook doesn't care what browser extension the shopper installed.
How Do You Segment and Analyze Funnel Data?
Raw funnel numbers hide almost everything useful. The value comes from breaking the funnel apart by segment until you find where the drop-off actually concentrates.
Start with these segment recipes:
- New visitors versus returning customers
- Traffic source and specific campaign
- Landing page (especially for paid traffic, where landing page mismatch is a common silent killer)
- Device type, since mobile and desktop funnels rarely convert at the same rate
- Country or region
- Promo code usage
- Cohort by acquisition date, to see whether a recent change affected only new traffic or your whole base
Google Analytics lets you apply breakdowns by dimensions like country directly inside a funnel exploration, and the same documentation notes options like trended funnels and average time between steps, both useful when a drop-off looks sudden but is actually a gradual erosion. Once you've built a view worth keeping, GA4 also lets you save it as a standing funnel report so you're not rebuilding the same breakdown every week.
Attribution model choice changes how you interpret funnel performance across channels, not just how much credit each channel gets. A last-click model will make your checkout-abandonment retargeting campaign look artificially strong, because it's capturing credit for demand another channel generated. If you're comparing channel performance inside a funnel view, keep the attribution window consistent across the comparison, and be explicit about which window you're using when you report results to stakeholders. Tools that connect ad-platform event data directly to order records, similar to the approach described in Alpomi's conversion funnel analytics, make this considerably easier than manually joining spreadsheets from three different ad accounts.
Quantitative drop-off tells you where. It almost never tells you why. If checkout abandonment jumps 8 percentage points overnight, a funnel chart shows you the fact but not the cause.
Pro Tip: Pair every significant drop-off finding with a qualitative check before you build a fix. Session replay tools, on-page surveys, and heatmaps routinely surface the actual cause in minutes, things like a broken coupon field or a shipping-cost surprise, that pure funnel math can't diagnose on its own.
Which Tools Should You Use for Funnel Tracking?
No single platform covers every layer of a funnel tracking stack well. The right approach is usually two or three tools working together, each doing what it's best at.
Google Analytics (GA4) is the default for broad, free-tier funnel reporting. It handles standard checkout funnels well using events like begin_checkout and purchase, and its exploration interface supports breakdowns and trended views. Its data model is event-based, but sampling and interface limitations make it weaker for deep, granular product analytics.
Mixpanel and Heap both specialize in product analytics with a stronger focus on user-level behavioral detail than GA4 offers. Mixpanel requires more deliberate event planning; Heap auto-captures interactions, which trades setup speed for messier, harder-to-govern event schemas over time. Both are strong choices when you need to build cohort-based funnels tied to specific user actions rather than aggregate pageview counts.
Plausible takes a lightweight, privacy-first approach, with a simpler event model and no cookie banners required in most jurisdictions. Its funnel feature accepts both pageview and custom event goals and defaults to sequential mode, which makes it a reasonable choice for smaller stores that don't need enterprise-grade segmentation.
Mouseflow covers the qualitative side: session replay and heatmaps that show you exactly where a shopper hesitated, rage-clicked, or abandoned a form. It doesn't replace quantitative funnel tracking, but it answers the "why" that step conversion rates can't.
StorePush fits differently from the tools above. It doesn't measure the funnel. It acts on the moment a shopper leaves without completing one, using native iOS App Clips to re-engage browse and cart abandoners without needing an email address or phone number first. In a stack built around funnel visibility, StorePush is the recovery layer that sits downstream of your tracking, not a competing analytics platform.
A funnel chart can tell you that 78% of add-to-cart sessions never reach checkout. It cannot bring any of those shoppers back on its own. That gap between measurement and recovery is where most funnel investment quietly stalls.
When choosing your stack, check for four things: does the tool support cross-session, cross-device funnels, or only single-session views? Does it offer server-side ingestion, or only client-side pixels? Can it validate event schemas automatically, or will drift go unnoticed? And does the pricing model scale reasonably as your traffic grows, or does it punish success with a sudden tier jump?
Why Do Funnel Numbers Suddenly Look Wrong?
Funnel data breaks in predictable ways. Here are the failure modes worth knowing before they cost you a week of confused Slack threads.
Missing events happen when a deploy silently removes a tracking snippet, usually during a checkout redesign. Property drift occurs when someone renames product_id to productId in one part of the codebase without updating the rest. Double-firing shows up most often on thank-you pages that get refreshed or restored from bfcache, counting one purchase twice. Ad-block and ITP loss strips client-side pixels for a meaningful share of privacy-conscious traffic, deflating your funnel numbers without any real change in shopper behavior. Payment gateway redirects can break session continuity if your tracking doesn't survive the round trip to a third-party processor and back. Session stitching errors cause a single shopper's journey to appear as two disconnected sessions, fragmenting your funnel data. Sampling and attribution-window quirks in some analytics platforms can quietly understate high-traffic funnels.
When you spot a number that looks off, run this sequence:
- Compare your tracked
order_completedcount against actual orders in your order management system for the same window - Check your event schema validation logs for rejected or malformed events
- Review bfcache and thank-you page refresh behavior in a staging environment
- Confirm your payment gateway redirect flow still preserves session or user identifiers on return
Prevention beats detection every time. Deduplicate by order_id at the point of ingestion. Lock event schemas in continuous integration so a bad property name never reaches production. Add server-side purchase events so client-side pixel loss doesn't touch your revenue numbers. Schedule weekly reconciliation as a recurring calendar event, not a "when we remember" task. And set an alert threshold on large percentage shifts in any core funnel metric, so a broken tracking snippet gets caught in hours, not weeks.
If you notice a sudden drop, don't panic and start rebuilding dashboards. Triage first: check for a recent deploy, check your event logs, check the order system reconciliation, and only then start looking at genuine behavioral causes like a pricing change or a competitor promotion. Statista's data on cart abandonment reasons is a useful reference point when you've ruled out tracking errors and need to consider real shopper behavior, like unexpected shipping costs or a forced account creation step, as the actual cause.
What Should Your Instrumentation Checklist Look Like?
Prioritize in this order, and don't skip ahead.
- Canonical event list, locked and documented: the six core events plus any store-specific additions.
- Required properties on every event:
order_id,product_id,value,currency,quantity, plus a stable user identifier. - Server-side revenue events as your authoritative purchase record, independent of browser or ad-block interference.
- Deduplication rules built around
order_id, applied consistently whether the event comes from client or server. - Consent-state handling documented so your team knows exactly what changes when a shopper accepts or declines tracking.
- Automated schema validation, ideally in CI, rejecting any event that doesn't match your locked schema.
Run a reconciliation weekly: pull your tracked purchase count and compare it directly against your order management system's completed order count for the same period. A small variance is normal, since edge cases like manual orders or test transactions exist in most stores. When the gap widens noticeably beyond your usual baseline, that's your signal to investigate immediately rather than wait for the monthly report.
A few integration notes worth knowing before you connect your stack. GA4 works well out of the box for standard checkout events but needs explicit configuration for custom properties beyond its default ecommerce schema. Mixpanel and Heap both expect more deliberate upfront event planning; retrofitting a messy Heap auto-capture setup into clean funnel stages later is more work than planning it correctly from day one. Plausible's lighter model means fewer configuration options, which is a feature for smaller stores and a limitation for anyone needing granular segmentation. And StorePush's integration point sits after your purchase and abandonment events are already firing, since its role is triggering re-engagement, not replacing your core analytics.
Pro Tip: Give one person, not a committee, ownership of the tracking plan. Funnel data rot almost always traces back to a change nobody flagged because "tracking" wasn't clearly anyone's job.
What I'd Prioritize If I Were Rebuilding a Funnel From Scratch
Instrumentation comes before dashboards, every time, no exceptions. Teams routinely reverse this order: they buy a slick analytics tool, wire it up loosely, and only discover months later that the underlying event data was never trustworthy. A dashboard built on inconsistent events is worse than no dashboard at all, because it creates false confidence.
Weekly reconciliation deserves the status of a habit, not a project. The moment it becomes optional, it gets skipped during a busy launch week, which is exactly the week something breaks. Treat it the same way you'd treat a financial close process: scheduled, owned, and never quietly dropped when things get busy.
Governance matters more than most marketing teams want to admit. A versioned tracking plan, kept in the same repository as your codebase, with schema changes reviewed in pull requests like any other code change, prevents the slow property drift that quietly corrupts historical comparisons. Assign a small cross-functional group, someone from marketing, someone from engineering, someone who owns the order system, to review that plan quarterly.
Placeholder: brand_signal
Placeholder: author_bio
How Does StorePush Fit Into Your Funnel Strategy?
Once your funnel tracking is solid enough to trust, the next question is what you do about the shoppers who still drop off, because even a well-optimized checkout will lose the majority of visitors before purchase. StorePush plugs directly into that gap. It captures browse and cart abandonment moments and re-engages those shoppers through native iOS App Clip push notifications sent straight to a lock screen, without ever needing an email address or phone number first. That matters because most funnel tracking stops at measurement. It doesn't bring any of them back. StorePush's dashboard also attributes recovered revenue directly to the notifications that drove it, so the recovery layer feeds back into the same funnel data you're already tracking rather than living in a disconnected silo.

If you're already running the instrumentation checklist above and want the recovery half of the equation solved without building a custom retargeting flow from scratch, book a demo with StorePush to see how the App Clip flow attaches to your existing checkout events. You can also review the full product overview to see how it integrates with Shopify, WooCommerce, BigCommerce, and custom storefronts.
What Are the Best Resources for Learning Ecommerce Funnel Tracking?
- BigCommerce's Purchase Funnel Report documentation: best for understanding standard funnel step definitions and the platform-native conversion rate formula.
- Plausible's funnel analysis docs: best for a clear explanation of sequential versus strict funnel types.
- Google Analytics ecommerce exploration guide: best for hands-on GA4 setup instructions and checkout-specific event steps.
- Shopify's ecommerce sales funnel guide: best for understanding the five-stage funnel model and stage-specific KPIs.
- Statista's cart abandonment data: best as a benchmark reference when diagnosing why shoppers abandon carts.
Frequently Asked Questions
What is the minimum number of events needed for reliable ecommerce funnel tracking?
Six events cover the vast majority of use cases: session_start, product_viewed, add_to_cart, checkout_started, payment_info_submitted, and order_completed. Add store-specific events only after this core set is validated and stable.
How often should I check my funnel tracking accuracy? Run a reconciliation between tracked purchases and your order management system weekly. Check step conversion rates and drop-off percentages daily, since those shift quickly with traffic or deploy changes.
Should I use a closed or open funnel for my ecommerce store? Use a strict, closed funnel for your checkout flow specifically, since step order genuinely matters there. Use an open or sequential funnel for the broader browse-to-purchase journey, since shoppers frequently cross sessions and devices before buying.
Why don't my analytics tool's purchase numbers match my actual orders? Common causes include double-firing from thank-you page refreshes, ad-blockers stripping client-side tracking pixels, missing server-side purchase events, or property drift in your event schema. Weekly reconciliation against your order management system is the fastest way to catch this early.
What's the difference between cart abandonment rate and checkout abandonment rate? Cart abandonment rate measures the share of created carts that never convert to an order. Checkout abandonment rate scopes narrowly to sessions that already reached the checkout step, isolating payment and shipping friction from earlier browsing hesitation.
Sources
- Ecommerce Analytics Reports | Purchase Funnel Report
- Funnel analysis — Plausible docs
- Build explorations to view your ecommerce data — Google Analytics Help
- Ecommerce Sales Funnel: Stages & Metrics to Track (2026) - Shopify
- Statista — Reasons for cart abandonment worldwide
Recommended
- How to Increase Conversions: 10 Strategies (and the One Most E-Commerce Brands Miss) | StorePush
- CRO for E-Commerce: Stop Optimizing Only for the 7% Who Add to Cart | StorePush
- Cart Abandonment Is a Browsing Problem, Not a Checkout Problem | StorePush
- Shopify Conversion Rate Optimization: The Complete Guide (2026) | StorePush