
The six metrics every push notification program needs to track are delivery rate (accepted by push service), impression/view rate, click-through rate (CTR), conversion rate, opt-in/opt-out rate, and revenue per notification. Together, they form a diagnostic chain: delivery tells you whether the message reached the device, CTR tells you whether the message was relevant, and conversion rate tells you whether the destination delivered on the promise. Tracking all six means you can pinpoint exactly where a campaign breaks down instead of guessing.
Quick reference for skimmers:
- Delivery/Accepted rate — diagnoses token and push-service health
- Impression/View rate — reveals OS throttling and Do Not Disturb effects
- CTR (clicks ÷ delivered) — measures message relevance and copy quality
- Conversion rate — exposes landing page and deep-link failures
- Opt-in/Opt-out rate — tracks audience health and frequency damage
- Revenue per notification — ties push directly to business outcomes
Key Takeaways
Reliable push notification analytics requires four core metrics (delivery rate, CTR, conversion rate, opt-out rate) computed on accepted/delivered denominators, with revenue per notification as the primary business-outcome figure for e-commerce.
| Point | Details |
|---|---|
| Use accepted as your denominator | CTR and conversion rate computed on sent inflate results; use push-service accepted for every engagement metric. |
| Map KPIs to campaign objectives | Cart recovery prioritizes revenue per notification; re-engagement prioritizes retention lift; each needs a guardrail metric. |
| Instrument four events minimum | Log sent, accepted, displayed, and clicked with campaignId and variant on every message before running any A/B test. |
| Frequency discipline protects revenue | Android opt-in averages 81% and iOS 51%; opt-out spikes from over-sending erode that audience faster than any copy test can recover it. |
| StorePush for e-commerce recovery | StorePush provides built-in delivery, CTR, and revenue attribution for cart abandonment without requiring email or phone data. |
Table of Contents
- What push notification analytics actually measures and why each metric matters
- How to map campaign objectives to the right KPIs
- Exact formulas for every essential push metric
- How to instrument delivery data reliably across platforms
- Segmentation, timing, and personalization tactics driven by analytics
- A/B testing push notifications: how to design experiments that give you real answers
- How to interpret metric changes and act on them quickly
- A concrete instrumentation checklist and dashboard to build now
- The minimal metric stack most teams should start with
- StorePush handles the analytics and recovery funnel for e-commerce teams
- Sources
What push notification analytics actually measures and why each metric matters
Push notification analytics is the practice of capturing, computing, and acting on the event data generated when a message moves from your server to a user's screen and beyond. The term "notification analytics" is sometimes used interchangeably with "push metrics" or "mobile notification tracking," but the discipline covers the full funnel: from the moment your platform fires a send request to the moment a user converts or unsubscribes.
The delivery funnel: sent, accepted, received, displayed
Firebase Cloud Messaging documents four distinct delivery gates: sent (your server dispatched the message), accepted (the push service acknowledged it), received (the device SDK confirmed receipt), and displayed/impression (the notification appeared on screen). Each gate can drop messages for different reasons, which is why treating "sent" as a proxy for "delivered" produces misleading denominators across every downstream metric.
- Sent — the raw dispatch count from your server or platform
- Accepted/Delivered — the push service (FCM, APNs) returned a 201/success; this is the preferred denominator for CTR
- Received — the device SDK confirmed the message arrived (Android only, background; iOS does not expose this natively)
- Displayed/Impression — the notification rendered on screen; the gap between accepted and displayed reveals OS throttling, battery optimization, and Do Not Disturb
CTR and open rate
OneSignal defines CTR as clicks divided by delivered (accepted), not clicks divided by sent. Low CTR typically points to a relevance, timing, or copy problem rather than a delivery failure.
Open rate is sometimes used as a synonym for CTR in push contexts, but the two can diverge when a platform counts a notification tap that opens the app separately from a click on an action button. Standardize on one definition internally and document it.
Conversion rate and revenue per notification
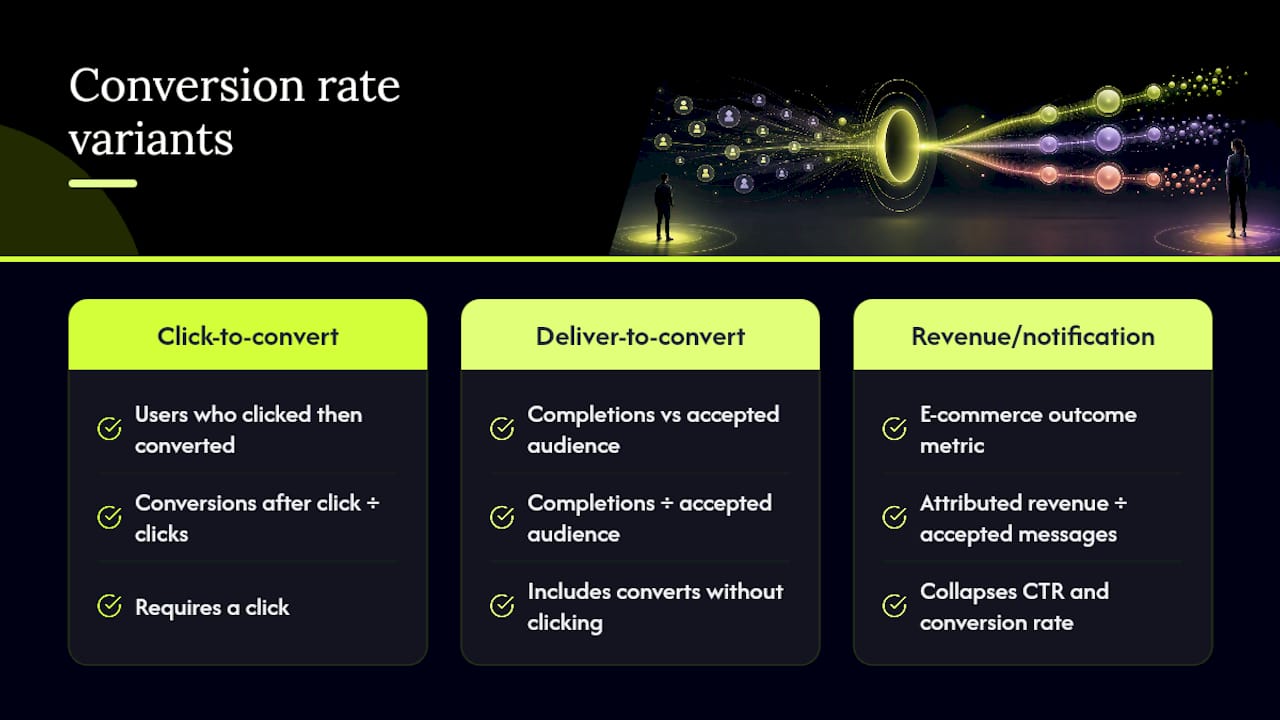
Conversion rate has two useful variants. Click-to-convert measures the share of users who clicked and then completed a target action (purchase, sign-up, form fill). Deliver-to-convert measures completions against the full accepted audience, capturing users who converted after seeing the notification without clicking. For e-commerce, revenue per notification (total attributed revenue ÷ accepted messages) is often the single most useful number because it collapses CTR and conversion rate into one business-outcome figure.
Opt-in, opt-out, and retention
Business of Apps benchmarks show Android opt-in rates averaging around 81% and iOS opt-in rates averaging around 51%, a gap driven by iOS's explicit permission prompt. Opt-out rate (unsubscribes per campaign ÷ active subscribers) is the earliest warning signal for frequency or content mismatch. Retention lift measures whether users who receive push notifications return to the app at higher rates than a holdout group, making it the right metric for re-engagement campaigns.
Statistic: Android reaction and CTR rates consistently outperform iOS equivalents, according to Business of Apps push benchmarks, largely because Android historically defaulted to opt-in while iOS required an explicit user prompt.
Time-to-open, the median elapsed time between a notification being displayed and a user tapping it, tells you whether your send window matches user behavior. A long median time-to-open suggests the message arrived when users were unavailable, which is a timing problem, not a copy problem.
How to map campaign objectives to the right KPIs
Picking the wrong primary KPI is one of the fastest ways to optimize a metric that doesn't move revenue. A campaign optimized purely for CTR, for example, can inflate clicks through misleading copy while quietly driving up opt-outs and eroding the addressable audience.
The guardrail column is not optional. Guardrail metrics exist to catch the side effects of optimizing the primary KPI too aggressively. For cart recovery, if revenue per notification climbs but opt-out rate spikes, you are burning your subscriber list to hit a short-term revenue number.
Measurement windows matter. A 24-hour attribution window suits flash sales and time-sensitive alerts. A 72-hour window fits most e-commerce cart recovery scenarios where users deliberate before purchasing. A 7-day window is appropriate for subscription or SaaS re-engagement where the decision cycle is longer. Choose the window before the campaign launches and hold it constant across variants.
Two short examples:
- E-commerce cart recovery: Primary KPI is revenue per notification. A retailer sending cart reminders measures attributed purchases within 72 hours of the accepted notification. Guardrails are opt-out rate (cap at a 0.5% increase per campaign) and delivery rate (flag if it drops more than 10% from baseline).
- News breaking alerts: Primary KPI is impression rate, because the goal is awareness, not a click. CTR is secondary. Opt-out rate is the guardrail because high-frequency alert senders are among the fastest categories to lose subscribers.
Exact formulas for every essential push metric
Getting the denominator right is the most common instrumentation mistake. Use accepted/delivered as the standard denominator for engagement metrics. Use sent only when measuring push-service acceptance itself.
Canonical formulas:
- Delivery Rate = Accepted ÷ Sent × 100
- View/Impression Rate = Displayed ÷ Accepted × 100
- CTR = Clicks ÷ Accepted × 100
- Click-to-Convert Rate = Conversions ÷ Clicks × 100
- Deliver-to-Convert Rate = Conversions ÷ Accepted × 100
- Opt-In Rate = New subscribers ÷ Permission prompts shown × 100
- Opt-Out Rate = Unsubscribes ÷ Active subscribers at campaign start × 100
- Revenue per Notification = Total attributed revenue ÷ Accepted
- ARPU (push-attributed) = Total attributed revenue ÷ Unique users who received the notification
- Time-to-Open = Median(timestamp of click − timestamp of displayed)
The Web Push Notifications guide recommends using the push service's 201 (accepted) response as the CTR denominator for web push, and notes that the gap between accepted and displayed is where OS throttling and browser backgrounding losses show up.
Worked example 1: CTR calculation
A campaign sends 50,000 messages. Users click 1,380 times.
- CTR on sent = 1,380 ÷ 50,000 = 2.76%
- CTR on accepted = 1,380 ÷ 46,000 = 3.0%
The 0.24-point difference is real and matters when comparing variants in an A/B test where delivery rates differ between groups.
Worked example 2: Revenue per notification
A cart-recovery campaign accepts 12,000 notifications. Within 72 hours, 180 purchases are attributed to the push, totaling $9,000 in revenue.
- Conversion rate (deliver-to-convert) = 180 ÷ 12,000 = 1.5%
- Revenue per notification = $9,000 ÷ 12,000 = $0.75
That $0.75 figure is the number to beat in the next experiment. It accounts for both how many people clicked and how much they spent, so it is harder to game than CTR alone.
Attribution window note: Switching from a 24-hour to a 72-hour window on the same campaign will typically increase reported conversion rate and revenue per notification. Neither number is wrong; they measure different things. Document the window in every report header so no one compares a 24-hour figure against a 72-hour figure and draws a false conclusion.
How to instrument delivery data reliably across platforms
Reliable push notification analytics starts with capturing the right events at the right layer. Most teams under-instrument at the delivery layer and over-rely on click data, which means they cannot distinguish a relevance problem from a delivery failure.
The three delivery gates and why each needs its own event:
- Sent — logged server-side when your platform dispatches the request to FCM or APNs
- Accepted — logged when the push service returns a success response (FCM 200/201, APNs 200); this is the denominator for CTR
- Displayed/Impression — logged client-side by the SDK or service worker when the notification renders on screen
FCM's BigQuery export surfaces individual message logs that include acceptance status, delivery outcome categories (delivered, pending, skipped, dropped), and timestamps. Those per-message logs are what let you diagnose whether a delivery drop is caused by expired tokens, priority lowering, or device-side throttling.
Platform differences to account for:
- Android (FCM): Exposes received and impression events for background notifications via the Android SDK. BigQuery export provides per-message delivery outcome data. Priority flags (high vs. normal) directly affect whether a notification wakes the device.
- iOS (APNs): Does not expose a received event natively. Impression data requires a Notification Service Extension or Content Extension. Web push on iOS (added in iOS 16.4 for home-screen web apps) has additional constraints; see the iOS web push limitations for e-commerce-specific implications.
- Web push: Click beaconing must be handled in the service worker using
fetchwithkeepalive: trueso the beacon fires even when the user navigates away immediately after clicking.
Engineer instrumentation checklist:
- Enable FCM BigQuery export in the Firebase console and confirm the dataset is receiving message logs within 24 hours of activation.
- Attach
campaignId,variant, andanalyticsLabelto every send request payload; these fields survive the delivery pipeline and appear in BigQuery logs. - Record a
notification_displayedevent client-side (Android SDK callback or service workernotificationshowevent) and send it to your analytics warehouse with the samecampaignId. - Handle FCM 410 (registration token no longer valid) responses immediately by marking the token inactive; stale tokens inflate sent counts and deflate delivery rate.
- Deduplicate click events by
(messageId, userId, timestamp bucket)to prevent double-counting from service worker restarts or app cold starts. - Preserve
campaignIdin the notification payload's data object (not just the display fields) so it is available after an app cold start when the user taps a notification that was received while the app was closed.
Pro Tip: Carry campaignId and variantId in an encrypted data payload field alongside the display content. When a user taps a notification that launches the app from a cold start, read those identifiers from the launch intent (Android) or UNNotificationResponse (iOS) before any navigation occurs. Client-side, fire a click beacon using fetch with keepalive: true so attribution is not lost if the app immediately redirects to a deep-linked product page.
OneSignal's analytics overview recommends streaming message-level events to a warehouse or exporting CSV for any analysis that goes beyond the platform dashboard, particularly for conversion attribution and cohort analysis.
Segmentation, timing, and personalization tactics driven by analytics
Analytics data is only useful if it changes what you send, to whom, and when. The teams that get the most from push notification KPIs are the ones that feed metric signals back into segmentation and scheduling decisions within days, not quarters.
Segmentation wins that move metrics:
- Recency segments: Users active in the last 7 days respond very differently from users dormant for 30 days or more. Active users tolerate higher frequency and respond to promotional messages; dormant users need a single, high-value re-engagement message with a clear reason to return.
- Behavior segments: Cart value, product category interest, and purchase history all predict which message will resonate. A user who browsed running shoes twice in a week should not receive a generic "sale on everything" notification.
- LTV-based segments: High-LTV users warrant more conservative frequency caps because losing them to an opt-out costs more than losing a first-time visitor.
Timing and frequency:
Time-to-open data tells you when your audience actually reads notifications. If the median time-to-open for a segment is 4 hours after send, your 9 AM send is landing when users are busy and being read at 1 PM. Shift the send to 10 AM and you may see CTR improve without changing a word of copy. Per-user intelligent delivery, where the platform learns each user's typical engagement window, is the most reliable way to close the gap between send time and read time. The timing strategies that apply to SMS scheduling translate directly to push send-window experiments.
Frequency discipline is where most teams leave money on the table. Business of Apps data consistently shows that higher send frequency increases opt-out rates, and that one to two highly relevant notifications per campaign cycle is a common sweet spot for e-commerce. Sending five cart reminders in 48 hours may recover a few additional orders while permanently removing a larger share of subscribers from your addressable audience.
Personalization and rich formats:
Images, emojis, and deep links each lift engagement, and analytics should measure their impact separately. Run a test with and without an image before assuming rich format always wins; in some categories (B2B, financial services), plain text outperforms. Deep links that route directly to the abandoned cart page consistently outperform links that land on the homepage, because they eliminate the friction of the user having to find what they were looking at.
E-commerce cart recovery example: A user abandons a $120 cart. Segment: active in the last 7 days, first-time abandoner. Send one notification 1 hour after abandonment with a deep link to the cart and a product image. If no conversion within 24 hours, send a second notification with a time-limited offer. Measure opt-out rate per message and revenue per notification per message. If message 2's opt-out rate exceeds message 1's by more than 0.3 percentage points, the second touch is net-negative for that segment.
A/B testing push notifications: how to design experiments that give you real answers
Most push A/B tests fail not because the hypothesis was wrong but because the experiment was set up in a way that makes the result uninterpretable. Mixing send types, changing the audience mid-test, or using sent instead of accepted as the denominator all produce numbers you cannot act on.
Experiment design checklist:
- Test one variable at a time: headline copy, send time, rich media presence, or deep-link destination. Never combine two changes in a single variant.
- Randomize at the user level, not the message level, to avoid the same user receiving both variants.
- Use accepted/delivered as the denominator for all engagement metrics so delivery rate differences between variants do not contaminate CTR comparisons.
- Set your primary metric and guardrail metric before the test launches. Changing the primary metric after seeing early results is the push equivalent of p-hacking.
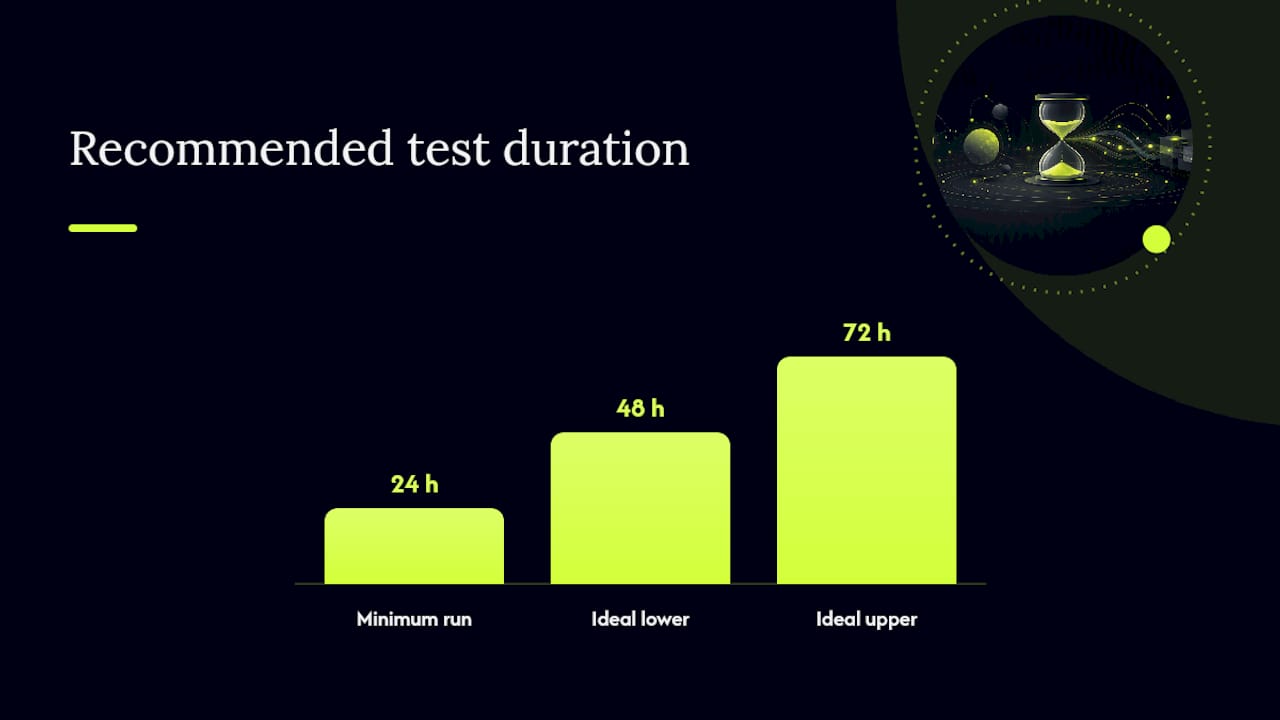
- Run the test for a full send cycle (at minimum 24 hours, ideally 48–72 hours) to account for time-of-day variation in user behavior.
- Attach
variantidentifiers to every event so you can compute per-variant metrics from raw logs, not just from the platform dashboard.
Sample experiment design:
| Variable tested | Variant A | Variant B | Primary metric | Guardrail | Decision rule |
|---|---|---|---|---|---|
| Headline copy | "Your cart is waiting" | "Still thinking it over?" | CTR (clicks ÷ accepted) | Opt-out rate | Ship B if CTR lifts ≥ 0.5 pp and opt-out rate does not increase |
| Send time | 9 AM local | 12 PM local | Revenue per notification | Delivery rate | Ship earlier window if revenue per notification lifts ≥ 10% |
| Rich media | No image | Product image | Click-to-convert | Opt-out rate | Ship image if conversion rate lifts and opt-out rate holds flat |
Common mistakes:
- Changing the audience segment mid-test invalidates the randomization and makes variant groups non-comparable.
- Using the platform's default dashboard CTR (which may use sent as the denominator) when your warehouse uses accepted creates an apparent discrepancy that is actually a denominator mismatch. OneSignal's CTR documentation flags this as one of the most frequent tracking pitfalls.
- Declaring a winner after 6 hours because one variant looks ahead. Small sample sizes produce noisy early results; wait for the pre-specified run time.
Statistical significance matters, but business impact matters more. A CTR lift of 0.1 percentage points that is statistically significant on a 500-message test is not worth shipping. Set a minimum detectable effect (MDE) before the test that represents a business-meaningful improvement, and size your sample accordingly.
How to interpret metric changes and act on them quickly
A tight metric stack separates delivery problems from relevance problems from conversion problems, which means you can route the fix to the right team without a lengthy diagnosis meeting.
Decision playbook by metric signal:
- Delivery rate drops more than 10% vs. baseline: Check FCM/APNs error logs for 410s (expired tokens) and 400s (malformed payloads). Run a token cleanup to remove stale registrations. Verify that payload size is within limits (4 KB for FCM data payload).
- Impression rate drops while delivery rate holds: OS throttling or Do Not Disturb is absorbing accepted messages before they display. Check Android battery optimization settings and notification channel priority. On iOS, verify that the notification category is configured correctly.
- Strong CTR but low conversion rate: The message is compelling but the destination is broken or mismatched. Audit the deep link: does it route to the exact product or cart page? Test the link on both Android and iOS after a cold start.
- High opt-out rate: Frequency is too high, content is irrelevant to the segment, or the message arrived at a disruptive time. Pull opt-out rate by segment and by send time to isolate the cause.
- Accepted rate is high but CTR is flat across multiple campaigns: The audience may be fatigued. Introduce a frequency cap, suppress users who have not clicked in 30 days, and run a re-permission or preference-center campaign.
Marketer action checklist:
- Adjust copy and CTA when CTR is low but delivery and impression rates are healthy
- Tighten segmentation when opt-out rate rises above baseline
- Shift send window when time-to-open median is more than 3 hours after send
- Reduce frequency for dormant segments before they unsubscribe
Engineer action checklist:
- Run token hygiene (remove 410s, validate token format) when delivery rate drops
- Raise FCM message priority to "high" for time-sensitive campaigns when impression rate lags
- Audit payload size and service-worker registration when click events are missing from logs
- Verify BigQuery export is current and
campaignIdfields are populated before any analysis run
A concrete instrumentation checklist and dashboard to build now
The goal here is a working reporting setup within a few days, not a perfect data warehouse in six months. Start with the events that matter most and add complexity as your team's analytical capacity grows.
Developer event checklist:
- Log
notification_sentserver-side withmessageId,campaignId,variant,userId,timestamp - Log
notification_acceptedfrom push service response with the same identifiers - Log
notification_displayedclient-side (Android SDK / service workernotificationshow) withmessageId,campaignId,timestamp - Log
notification_clickedclient-side withmessageId,campaignId,variant,timestamp,deepLinkUrl - Log
conversion(purchase, sign-up) withuserId,campaignId,revenue,timestamp— join tonotification_clickedornotification_acceptedwithin your attribution window - Log
notification_dismissedandopt_outwithuserId,campaignId,timestamp
Dashboard fields to build:
- Delivery rate (accepted ÷ sent), segmented by platform (Android/iOS/web)
- View/impression rate (displayed ÷ accepted)
- CTR (clicked ÷ accepted), by campaign and by variant
- Conversion rate (click-to-convert and deliver-to-convert)
- Revenue per notification and total attributed revenue
- Opt-in rate (new subscribers ÷ prompts shown) and opt-out rate by campaign
- Time-to-open (median, by segment and send time)
- Cohort retention: D1/D7/D30 return rate for users exposed to push vs. holdout
Alert thresholds to configure:
- Delivery rate drops more than 10% vs. 7-day rolling average: page on-call engineer
- Opt-out rate exceeds 1% for any single campaign: flag for marketer review before next send
- Conversion rate for top-LTV segment drops more than 20% vs. prior campaign: escalate to product and engineering
Sample SQL join to compute CTR by variant:
SELECT
  s.campaign_id,
  s.variant,
  COUNT(DISTINCT s.message_id) AS accepted,
  COUNT(DISTINCT c.message_id) AS clicks,
  ROUND(COUNT(DISTINCT c.message_id) * 100.0 / NULLIF(COUNT(DISTINCT s.message_id), 0), 2) AS ctr_pct
FROM notification_accepted s
LEFT JOIN notification_clicked c
  ON s.message_id = c.message_id
  AND c.timestamp BETWEEN s.timestamp AND s.timestamp + INTERVAL '24 hours'
GROUP BY s.campaign_id, s.variant
ORDER BY s.campaign_id, s.variant;
This join is the foundation. Add a conversion table join with the same campaignId and attribution window to extend it to revenue per notification. OneSignal's analytics documentation recommends exporting raw events to a warehouse for exactly this kind of cross-table analysis.
The minimal metric stack most teams should start with
Most teams instrument too little at first and then try to instrument everything at once after a campaign fails. Neither approach works. The right starting point is four metrics: delivery rate (accepted), CTR, conversion rate, and opt-out rate. Those four tell you whether the message reached users, whether it was relevant, whether it drove action, and whether it damaged your audience. Everything else is refinement.
When a product manager or marketer is deciding where to spend the next sprint, the answer is almost always: fix the CTA and the destination before asking engineering to improve delivery infrastructure. A 1-percentage-point CTR lift from better copy is faster to ship and often larger in revenue impact than a 2-point delivery rate improvement from token hygiene.
Cross-team collaboration is the real bottleneck. Marketing can identify that CTR is low, but only engineering can confirm whether the deep link is routing correctly after a cold start. The teams that run the fastest experiments are the ones where a marketer can file a ticket with a specific metric, a specific segment, and a specific hypothesis, and engineering can instrument and ship the fix within the same week. Keep experiments short (48–72 hours), pre-specify the decision rule, and document the result in a shared log so institutional knowledge accumulates.
StorePush handles the analytics and recovery funnel for e-commerce teams
For e-commerce teams running cart and browse abandonment recovery, the instrumentation work described above is real, but it does not have to be built from scratch. StorePush delivers push notifications directly to shoppers' lock screens using native iOS App Clips, without requiring an email address, phone number, or app install.
The platform integrates with Shopify, WooCommerce, and BigCommerce and includes built-in revenue attribution, CTR heatmaps, funnel tracking, and event-based triggers for cart and browse abandonment. You get delivery rate, CTR, and conversion data without writing a single SQL join.
For resource-constrained teams that need cart recovery working this week rather than next quarter, StorePush is the faster path to ROI. In-house instrumentation remains valuable for custom analytics and cross-channel attribution, but if your primary goal is recovering abandoned carts and measuring the revenue impact, a purpose-built tool removes months of setup. Book a demo to see the attribution dashboard and recovery funnel in action.
Sources
These resources cover the implementation details, denominator conventions, and industry benchmarks referenced throughout this article.
- Understand delivery of messages | Firebase Cloud Messaging
- Push Notifications Statistics (2026) - Business of Apps
- Measuring Push Notification Click-Through Rate
- 10 App Push Notification Metrics That Prove ROI