
Revenue attribution assigns actual order dollars to the marketing touchpoints that led to them, and it's not the same as conversion tracking, which just logs that a sale happened. Your first move should always be to reconcile every attributed dollar back to your store's real order count, then lock in one lookback window and stick with it. Skip that step and you'll chase numbers that platforms inflate through double-counting, especially once you start comparing channels.
TL;DR:
- Proper revenue attribution requires reconciling all tracked dollars with actual store orders to avoid inflated platform reports and double counting.
- Lookback window size critically influences attribution accuracy; shorter windows favor bottom-funnel channels, while longer ones credit upper-funnel efforts.
- Using multiple models, such as last click and data-driven, provides a fuller picture, especially when volumes are below 300 conversions per month.
- Accurate tracking depends on capturing order ID, UTM parameters, and customer identifiers, with server-side and first-party data reducing privacy-related gaps.
- Offline sales and push notification recoveries can be integrated into attribution models with proper cross-channel tracking to prevent underreporting.
Table of Contents
- What Does Revenue Attribution Mean in Ecommerce?
- Why Attribution Matters More Than Clicks-Only Reporting
- Which Attribution Model Should You Use?
- How to Set Up Ecommerce Revenue Tracking
- Why Your Lookback Window Changes the Answer
- How Do You Turn Attribution Data Into Budget Decisions?
- What Push Notifications Teach You About Attribution
- How Do You Fold Offline Sales Into the Attribution Picture?
- Can Machine Learning Improve Attribution Accuracy?
- Do GDPR and CCPA Affect How You Track Attribution?
- What Actually Matters Once the Reports Are Built
- Turn Push Recovery Into Attributed Revenue, Not a Guess
- Sources
- FAQ
What Does Revenue Attribution Mean in Ecommerce?
Attributable revenue is the portion of a sale a model assigns to a specific channel, campaign, or ad. Conversion tracking is simpler. It just confirms a transaction happened, without deciding which touchpoint gets credit for it. Confusing the two is why so many marketers argue about numbers that were never meant to answer the same question.
Two other terms decide how far apart your reports can drift. The model is the rule for splitting credit (last click gets everything, or every touch gets a share). The lookback window is how far back in time the model is allowed to look for those touches. A 7-day window and a 90-day window running the same model on the same data can produce wildly different channel rankings, because a shopper who saw a Meta ad 45 days before buying simply falls outside a 30-day window.
A few more terms show up constantly in dashboards:
- MER (media efficiency ratio): total revenue divided by total ad spend, model agnostic.
- Deduplication: removing double counted conversions across platforms so the sum doesn't exceed real orders.
- Stitching: linking a shopper's sessions across devices or visits into one journey.
- View through: a conversion credited to someone who saw, but never clicked, an ad.
Before you trust any attribution report, confirm it captures order ID, event value, UTM parameters, and a persistent customer ID. Missing any one of those four breaks the chain between a touchpoint and the dollars it supposedly earned.
Why Attribution Matters More Than Clicks-Only Reporting
Clicks tell you what got attention. Revenue tells you what got paid for, and those are frequently completely different channels. A retargeting ad might rack up cheap clicks all month while contributing almost nothing to the sales that actually close, and a store that allocates budget by click volume alone will keep feeding a channel that's coasting on other channels' work.
Shifting to dollar-based allocation changes real decisions: which channel gets next month's budget increase, which campaign gets paused, which "top performer" turns out to be stealing credit from an email flow that actually started the journey. Shoppers typically cross 8 to 10 touchpoints before buying, so a model that only recognizes the last click is throwing away information about everything that happened earlier in that path.
The failures that distort these numbers show up in predictable places:
- Platform over-claiming: Meta, Google, and TikTok each count conversions by their own rules, and their totals can add up to far more revenue than your store actually processed.
- Cookie loss: browser privacy changes and ad blockers erase touchpoints before they ever reach your reporting.
- Cross-device gaps: a shopper researching on their phone and buying on a laptop looks like two different people without stitching.
- UTM slippage: a missing or mistyped tag drops a session into "direct" or "unknown."
- Payment-redirect loss: hopping to a third-party checkout page can break the session and orphan the attribution data.
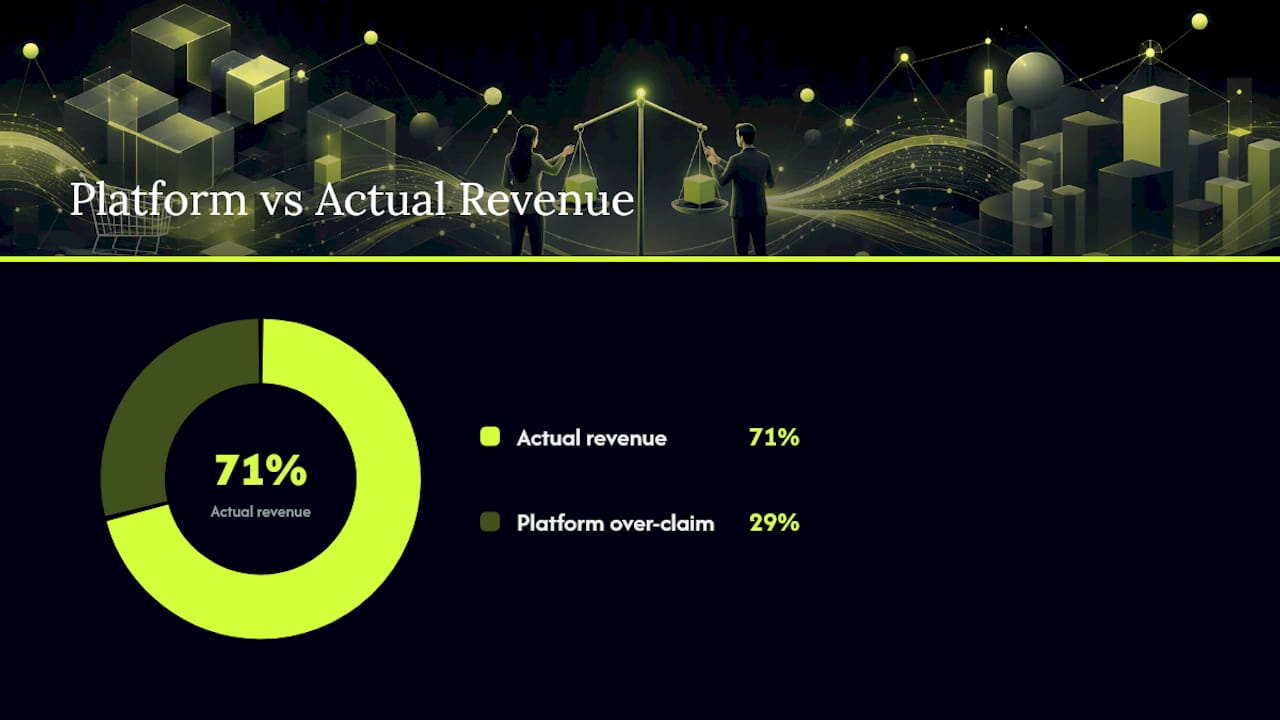
Platform sums routinely exceed real revenue by a substantial margin, often around one-third to over half again as much because each ad platform counts conversions independently, with no shared source of truth. That gap alone is reason enough to treat platform dashboards as directional, not final.
Which Attribution Model Should You Use?
No single model is "correct." Each one answers a slightly different question, and the smart move is running two or three side by side rather than betting everything on one number.
- Last click: gives 100% of the credit to the final touch before purchase. Simple, but blind to everything that built demand earlier.
- First click: credits the touch that started the journey. Useful for judging top-of-funnel and awareness spend, useless for judging what closes deals.
- Linear: splits credit evenly across every touchpoint. Fair in theory, but it treats a passing glance at a display ad the same as a deliberate cart return.
- Time-decay: weights recent touches more heavily than older ones. Good for shorter buying cycles where recency genuinely predicts intent.
- Position-based (U-shaped): gives extra weight to the first and last touches, splitting the rest across the middle. A reasonable middle ground for stores with multi-step journeys.
- Data-driven (Shapley-based, sometimes called Full Impact): uses your own conversion data to calculate each touchpoint's actual contribution, rather than applying a fixed rule.
Data-driven attribution sounds like the obvious answer, but it has a real data floor. GA4 defaults to data-driven attribution, and it generally needs roughly 300 to 400 conversions a month to produce reliable output. Below that volume, the model is guessing with too little evidence, even if the dashboard displays a confident number.
Here's a practical way to choose:
- If you're under that conversion threshold, run a rule-based multi-touch model, ideally U-shaped, and lean on MER as your top-level check.
- If you're above the threshold and have clean tracking, turn on data-driven attribution in GA4 and compare it against last click monthly.
- If your sales cycle is under a week, weight time-decay or last click more heavily. Longer cycles reward position-based or linear views.
- Whatever you pick, keep running last click alongside it. The gap between the two is itself useful information about how much credit is shifting away from the bottom of the funnel.
Treat multiple models as different camera angles on the same event, not competing claims to be argued into submission.
How to Set Up Ecommerce Revenue Tracking
Attribution is only as good as the data feeding it, and most attribution "problems" are actually tracking gaps wearing a fancier name.
- Send the right event payload. Every purchase event needs order ID, order value, currency, and basic product metadata. Miss the order ID and you can't deduplicate later, which is often where reconciliation quietly falls apart.
- Build a real UTM taxonomy. Standardize source, medium, and campaign naming before launch, not after. "fb_ad" and "facebook_ads" showing up as separate rows in a report is a self-inflicted wound.
- Add server-side capture. A server-side pixel or conversion API call survives ad blockers and browser restrictions that kill client-side cookies. Pair it with a persistent customer or lifetime ID so sessions stitch together across visits and devices.
- Reconcile everything to your store. Shopify's order data is the ground truth your platform reports get measured against. If Meta and Google combined claim more conversions than Shopify processed orders, something upstream is double counting.
- Prioritize your integration stack. GA4 for cross-site behavior, a post-purchase survey for the self-reported channel that never shows up in pixels, and a first-party pixel or event tracking on your Shopify storefront for the events that actually drive revenue.
Analytics platforms like Plausible support revenue-marked custom events, letting you filter total and average revenue by UTM or campaign without sending personal data through a third-party ad pixel, a useful option if privacy-first tracking matters to your store.
Pro Tip: Before debugging any attribution discrepancy, check whether the order ID is actually present in every platform's event payload. Nine times out of ten, a "broken" attribution report is really a missing identifier breaking deduplication further downstream.
Why Your Lookback Window Changes the Answer
The model you pick matters less than most marketers assume. What actually moves the number is your lookback window, the span of time a model is allowed to search for prior touchpoints before crediting a sale.
A 7 day window will credit almost everything to bottom-funnel channels like retargeting and branded search, because it never sees the ad that planted the idea three weeks earlier. Stretch that to 90 days and suddenly upper-funnel channels start claiming credit they never got before, not because performance changed, but because the measurement rule changed. Lookback window confusion, mixing up a window change with a model change, is one of the most common causes of a channel suddenly looking like it "stopped working."
Two settings do more to move your attribution results than model choice ever will: the window length, and whether you deduplicate against your actual order count.
- Match your window to your buying cycle. A store selling $30 impulse items doesn't need a 90 day window; a store selling $2,000 furniture might.
- Deduplicate against Shopify orders every time. If your combined platform totals exceed real order volume, you have a counting problem, not a marketing problem.
- Never compare two reports pulled with different windows. That comparison isn't measuring channel performance; it's measuring the window difference.
- Document the model and window on every report you publish. A number without that context is unverifiable to anyone reading it later, including future you.
Platform totals summing 30 to 60 percent above actual revenue isn't a rare glitch, it's the default state of unreconciled multi-platform reporting. Reconciling your window and deduplication settings against your own order data is the fix, not switching models again.
How Do You Turn Attribution Data Into Budget Decisions?
Attribution tells you a story about where credit landed. It doesn't tell you what happens if you pull the money out of a channel, and that gap is where a lot of budget decisions go wrong.
Start with MER, total revenue divided by total ad spend across all channels. It ignores model disputes entirely and gives you one honest number: are you spending profitably overall, right now? When channel-level attribution reports disagree with each other, MER is the number that keeps the argument grounded in reality.
Attribution models estimate correlation. Incrementality testing measures causation. Holdout tests, pausing a channel in one geography while running it normally in a similar one, then comparing the sales delta, tell you what a channel actually adds, rather than what it merely claims.
- Monthly: run your two or three chosen models side by side and note where they diverge sharply, that divergence usually flags a tracking issue worth investigating.
- Quarterly: run an incrementality test on your highest-spend channel using a geo-split or holdout design, then calculate incremental ROAS from the actual sales difference.
- Every reporting cycle: log any change to model, window, or tracking setup in a shared document before the next report goes out, so nobody mistakes a settings change for a performance shift.
Pro Tip: If a channel's attributed revenue and its incrementality test results tell wildly different stories, trust the incrementality test. Attribution can be gamed by good creative that simply captures existing demand; a holdout can't.
What Push Notifications Teach You About Attribution
Push-driven recovery revenue is a useful stress test for any attribution setup, because it exposes the same double-counting risk that plagues email and paid social, just faster. StorePush's own incrementality testing on push recovery shows why holdout comparisons matter even for a channel that feels obviously causal, someone abandoned a cart, got a notification, came back and bought.
The mechanics matter here. StorePush captures click IDs server-side and applies P90 to P95 attribution windows tuned for push behavior, rather than borrowing a generic 30 day web window that was never built for a notification someone taps within minutes.
A short checklist for attributing push-recovered purchases without double counting:
- Confirm the order's click ID matches a push send before crediting the channel.
- Set a push-specific lookback window rather than reusing your email or paid social default.
- Reconcile push-attributed orders against Shopify before reporting recovered revenue upward.
- Treat push as one input into MER and your multi-touch model, not a channel measured in isolation.
Push sits alongside your other channels in the same stitched, order-reconciled stack, not in a separate silo with its own rules.
How Do You Fold Offline Sales Into the Attribution Picture?
Ecommerce brands with a retail counter, pop-up, or wholesale arm face a real blind spot: a customer who researched online and bought in person looks, in your digital dashboard, like a lost conversion. The fix is connecting point-of-sale data to the same customer and order framework you use online.
Start with a shared identifier. If your point-of-sale system can capture an email, phone number, or loyalty ID at checkout, match it against your online customer records to link the two histories together. Where that's not possible, unique discount codes or QR codes tied to a specific campaign let you at least trace which offline sales originated from a digital push, even without a full identity match.
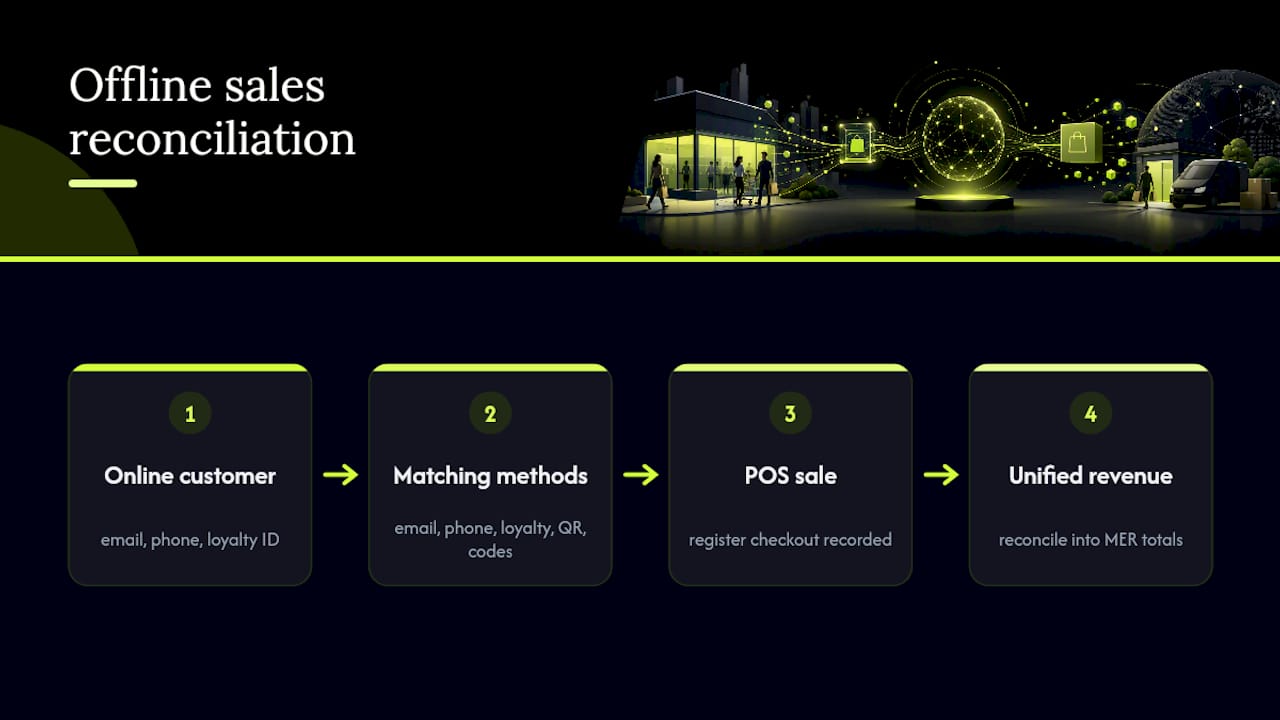
Feed offline order value into the same revenue total you use for MER calculations. A store that only counts online revenue against online ad spend will consistently understate its real marketing efficiency, sometimes badly, if a meaningful share of digitally influenced purchases happen at a register instead of a checkout page.
Attribution models built for click paths won't neatly explain a showroom visit that led to an in-store purchase three weeks later. Treat offline sales as a parallel data stream you reconcile against total revenue, rather than forcing them through the same touchpoint model built for web sessions. The goal isn't a perfect unified model, it's making sure a real sale doesn't vanish from your reporting just because it closed at a counter instead of a browser.
Can Machine Learning Improve Attribution Accuracy?
Data-driven attribution models, the kind GA4 runs by default, already lean on machine learning to estimate each touchpoint's actual contribution rather than applying a fixed rule like last click or linear.
The advantage shows up most clearly in complex, multi-channel journeys. A rule-based model treats every customer path the same way; a data-driven model can recognize that email plus retargeting converts differently than paid social plus organic search, and weight credit accordingly. That's a meaningfully more honest picture than any fixed formula can offer, when there's enough data behind it.
That advantage comes with a real floor, not a shortcut. Below roughly 300 to 400 monthly conversions, a data-driven model doesn't have enough examples to learn from, and its output can look precise while actually being a fragile estimate built on too few data points. Below that threshold, a rule-based multi-touch model paired with MER as a sanity check remains the more defensible choice.
Machine learning also can't fix a broken data pipeline. If your UTMs are inconsistent, your order IDs are missing, or your cross-device stitching doesn't work, a sophisticated model just produces a confident, sophisticated wrong answer faster. Fix the tracking first. Let the model do its job second.
Do GDPR and CCPA Affect How You Track Attribution?
Attribution tracking runs directly into privacy law, because most of what makes attribution work, cookies, device IDs, cross-site tracking, is exactly what regulations like the EU's GDPR and California's CCPA were written to constrain.
Under GDPR, tracking cookies used for marketing attribution generally require informed consent before they fire, not just a passive notice banner. That means a shopper who declines tracking cookies leaves a gap in your attribution path by design, not by accident, and no amount of clever modeling recovers data a regulation prevented you from collecting in the first place.
CCPA works differently. It centers on giving California consumers the right to know what data is collected and to opt out of its sale or sharing, which affects how you can use third-party data for attribution and retargeting even when you're not explicitly asking for cookie consent.
Both frameworks push the same practical direction: first-party data you collect directly, like order records, post-purchase survey answers, and server-side events tied to a logged-in customer, carries less legal exposure than third-party cookie-based tracking bought or shared across platforms. That's a large part of why server-side pixels and first-party stitching have become standard advice rather than a nice-to-have.
None of this is legal guidance for your specific business, and rules vary by where your customers live and how your store is structured. Treat this section as a reason to loop in someone who handles compliance before you finalize a tracking architecture, not as the final word on what's required for your store.
What Actually Matters Once the Reports Are Built
If you take one thing from all of this, take this: your store's order ledger is the only number that isn't negotiable. Every model, every window, every platform dashboard exists to explain that number, never to replace it. Pick a model that answers the specific question you're asking (budget allocation, channel comparison, funnel diagnosis), watch MER as your reality check, and run an incrementality test before you make a decision that costs real money.
The governance part is boring and that's exactly why most stores skip it, right up until a "channel collapse" turns out to be a lookback window someone changed without telling anyone. Publish the model and window with every attributed figure you report. Reconcile to orders before you reallocate a single dollar of budget.
— Lucas
Turn Push Recovery Into Attributed Revenue, Not a Guess
Push notifications only help your bottom line if you can prove which recovered orders actually came from them, and that's where most cart-recovery tools fall short: they claim credit without the tracking to back it up. A push notification recovery tool captures click IDs server-side and applies attribution windows tuned for how fast shoppers respond to a lock-screen notification, so recovered revenue gets tied to real orders instead of inflated estimates. It also works without collecting an email or phone number upfront, using native mobile technology to re-engage shoppers who might otherwise leave your funnel untracked entirely. If you're ready to see attributed recovery revenue in your own dashboard, book a demo and walk through how the setup fits your store.
Sources
A few resources are worth keeping open while you build or audit an attribution setup:
- Ecommerce Attribution Models: The 2026 Guide to Understanding Your Customer Journey — ReferralCandy
- Revenue Attribution for Ecommerce: How to Tie Marketing Spend to Actual Revenue — Polar Analytics
- Attribution Modeling for Ecommerce: Which Model Actually Works in 2026 — eSellSphere
- Ecommerce revenue and attribution tracking | Plausible docs
Check platform documentation directly before changing your lookback window or switching models. Defaults shift between product updates, and a setting that behaved one way last quarter isn't guaranteed to behave the same way today.
FAQ
What does revenue attribution mean?
Revenue attribution assigns actual order dollars, not just conversions, to the specific marketing touchpoints that led to a purchase, using a defined model and lookback window.
What is the 80/20 rule in ecommerce?
It's the general observation that a small share of products, customers, or channels typically drives most of a store's revenue, so attribution and budget decisions should focus first on identifying which ones those are.
What is the revenue model for ecommerce?
Ecommerce revenue comes primarily from direct product sales, and stores commonly layer in subscriptions, bundles, or recovered-cart revenue from tools like push notifications and email flows on top of that base.
What is attributable revenue?
Attributable revenue is the dollar amount a model credits to one channel or campaign, calculated by reconciling touchpoints against real store orders, then applying model weights like last click, linear, or data-driven splits.
How reliable is data-driven attribution for smaller stores?
Data-driven attribution needs roughly 300 to 400 monthly conversions to produce stable results; stores below that volume get more reliable answers from a rule-based multi-touch model paired with MER.