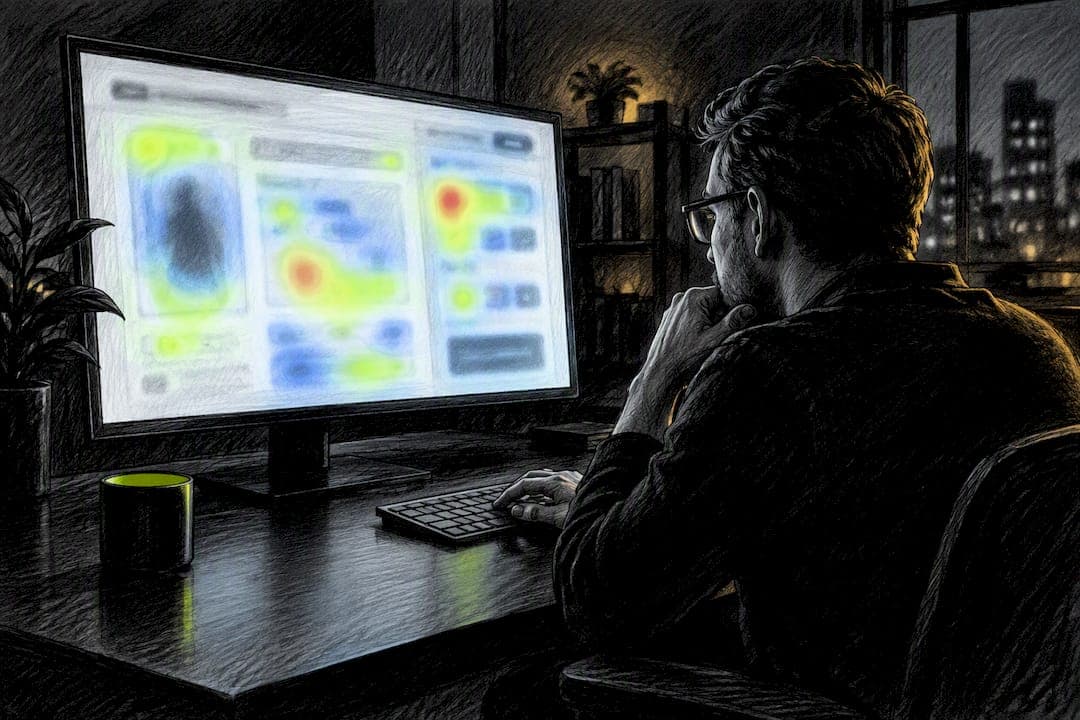
CTR heatmaps show you which clicks on your Shopify store actually lead to a purchase, not just which elements get tapped the most. That distinction is the whole point: a busy click zone that never converts is a distraction, and a quiet element with a high conversion overlay is where your revenue lives. Your first move is simple. Turn on a Shopify-native heatmap tool or a Web Pixel, then compare mobile and desktop overlays on your top three revenue pages.
TL;DR:
- Heatmaps must be interpreted based on their focus; conversion overlays reveal which elements actually drive sales, unlike raw click counts.
- Using Shopify-native tools or web pixels ensures accurate, durable data collection that survives theme updates and maintains privacy compliance.
- Analyzing mobile versus desktop heatmaps on top revenue pages helps prioritize fixes for high-impact friction points that affect mobile users most.
- Combining heatmap insights with session recordings confirms whether observed issues cause genuine shopper frustration or are just perceived problems.
- Pairing prioritized UX fixes with lock-screen re-engagement tools recovers visitors who abandon at key checkout steps without requiring contact information.
Table of Contents
- What Are CTR, Click, Area, and Conversion Heatmaps on Shopify?
- How Do You Set Up CTR Heatmaps on a Shopify Store?
- Reading CTR Heatmaps to Find Checkout Friction
- How Do You Prioritize and Test Heatmap-Driven Fixes?
- Privacy, Performance, and Technical Limits on Shopify
- Turning Heatmap Signals Into Recovered Revenue
- What I'd Check First After Reading a Heatmap
- How StorePush Fits Into Your Heatmap-Led Fixes
- Sources
- FAQ
What Are CTR, Click, Area, and Conversion Heatmaps on Shopify?
Not all heatmaps measure the same thing, and confusing them leads merchants to fix the wrong problem.
Click maps show individual tap or click locations at the element level. They're good for spotting dead clicks (shoppers tapping something that doesn't respond) or rage clicks (repeated frustrated taps on a broken filter or a slow-loading button).
Area maps aggregate clicks across defined page zones, giving you CTR per section rather than per pixel. This is useful when you want to compare whole blocks, like your hero banner against your product recommendation carousel, without getting lost in individual element noise.
Conversion overlays go a step further. Microsoft Clarity's conversion heatmap shows the percent of sessions that led to a purchase after a shopper clicked a given element, so a product thumbnail might show a 2.4% conversion rate while a "learn more" link nearby shows almost zero.
Here's when to reach for each one:
- Click maps: diagnosing broken UI or confusing navigation
- Area maps: comparing zone performance across a homepage or product listing page
- Conversion overlays: deciding which elements actually deserve more visual weight because they drive sales
On a typical Shopify store, you'll see this play out with product-image taps on the PDP, "apply discount code" clicks in checkout, and banner taps that promise a sale but rarely lead anywhere.
How Do You Set Up CTR Heatmaps on a Shopify Store?
Getting heatmap data flowing on Shopify comes down to two practical paths, and the choice affects how accurate and durable your data turns out to be.
- Install a Shopify-native heatmap or session-replay app using a theme app embed or app extension. This keeps the tool inside Shopify's supported integration points instead of injecting scripts directly into theme files.
- Implement a Web Pixel tied to Shopify's own customer events. The Web Pixels API exposes event hooks like
page_viewed,product_viewed, and checkout progression, along with init context that lets a pixel attach cart and order data to a click. - Confirm DOM anchoring. Heatmaps that map clicks to actual DOM elements, rather than static screenshots, keep working correctly after a theme update. Screenshot-based tools break the moment your layout shifts, which quietly corrupts your data without any warning.
Give a page at least a couple hundred sessions before you trust its heatmap. Anything less and you're reading noise, especially on lower-traffic product pages.
Pro Tip: Before you install anything, check whether your theme already supports app embeds natively — installing through that path instead of a raw script tag cuts your risk of conflicting with checkout extensibility or slowing page load.
On the technical side, Web Pixels run inside Shopify's own sandbox and use init.customerPrivacy to expose the visitor's consent state, which matters both for compliance and for making sure your pixel only fires when it's allowed to.
Reading CTR Heatmaps to Find Checkout Friction
The most useful signal in a conversion overlay isn't the highest click count. It's the gap between click volume and conversion rate.
An element with heavy traffic and a weak conversion overlay is a vanity click, something that draws attention without driving sales. A quieter element with a disproportionately high conversion rate is telling you to give it more visual real estate, not less. This is where merchants used to reading raw click counts get misled: the loudest zone on the page is rarely the one that pays the bills.
Checkout is where this framework earns its keep. Segmenting heatmap data by checkout step, as Clarity recommends, lets you see exactly where shoppers stall: the shipping method selector, the discount code field, or the contact information step. Mobile is almost always where the real damage happens. Tap targets that look fine on a 15 inch laptop screen turn into missed taps and dead clicks on a phone, and that friction rarely shows up unless you split your overlays by device.
Before you touch any UI, pull the session replays tied to those hot spots. Pairing heatmap signals with recordings confirms whether a rage click means genuine frustration or just an impatient double tap. Skipping this step is how teams "fix" something that was never actually broken.
Four numbers should guide every decision here:
- Element CTR — is this thing getting clicked at all?
- Element conversion rate — do those clicks turn into orders?
- Revenue per session — the metric that keeps you honest when conversion rate looks good but average order value quietly drops
- Sessions threshold — enough traffic to trust the signal, not just a lucky afternoon
Most Shopify stores convert somewhere between 1% and 3%, with the strongest performers hitting 3% to 5%. Friction like dead clicks and poor mobile scroll depth accounts for a meaningful share of the gap between an average store and a top performer, and heatmaps are how you find exactly where that friction lives.
How Do You Prioritize and Test Heatmap-Driven Fixes?
Not every friction point deserves the same urgency. Run each candidate fix through a simple rubric: expected revenue impact, multiplied by how cheap it is to implement, multiplied by your confidence in the signal (strong heatmap pattern plus solid session count beats a hunch based on twelve visits).
- Rank by revenue impact first. A checkout step losing shoppers on your highest-AOV product beats a cosmetic tweak on a low-traffic landing page.
- Choose your test method by traffic. Standard A/B testing needs volume to reach significance. Below roughly 1,000 sessions per week per variant, sequential testing tends to work better because it doesn't force you to wait for a fixed sample size before reading results.
- Start with the cheap, high-ROI fixes. Bigger tap targets, clearer CTA copy, moving shipping cost estimates earlier in the flow, and simplifying discount code entry are the fixes that consistently pay off with minimal engineering.
- Roll winners sitewide only after revenue per session confirms the lift, not just conversion rate. A variant that raises clicks but shrinks average order value isn't a win, it's a trade.
Pro Tip: If a CTA fix is on your shortlist, borrow from direct-response copywriting before you touch the button color; strong CTA framing often moves conversion more than any visual redesign. Our guide to Shopify conversion optimization walks through the full testing framework in more depth, and our mobile checkout fixes piece covers the tap-target and sticky add-to-cart issues heatmaps tend to surface first.
Privacy, Performance, and Technical Limits on Shopify
Heatmap tools live inside real constraints on Shopify, and ignoring them costs you either compliance or page speed.
- Web Pixels run in a sandbox specifically to limit main-thread impact, and you subscribe to
visitorConsentCollectedthroughinit.customerPrivacyso pixels only fire once consent is confirmed. - Required privacy flags get declared in
shopify.extension.toml, and Shopify's pixel manager only loads the pixel when those declared permissions match the visitor's actual consent state. - DOM-anchored heatmaps survive theme updates far better than screenshot-based tools, which quietly go stale the moment your layout changes.
- Mask any PII and never record sensitive fields like payment details, and favor Shopify-managed embeds over third-party scripts running on the main thread, since that's what protects your Core Web Vitals.
Turning Heatmap Signals Into Recovered Revenue
Heatmaps tell you exactly where a shopper hesitated, whether that's the shipping calculator, the discount field, or a tap target that never registered. StorePush picks up from there. It can target visitors who abandoned at those specific checkout steps using native iOS App Clips delivered straight to a shopper's lock screen, without ever collecting an email or phone number.
That matters because most abandonment recovery tools need contact data you'll never get from the vast majority of visitors who leave. Pairing your prioritized UX fixes with this kind of re-engagement means you're not choosing between fixing the funnel and recovering the shoppers who already fell out of it. You're doing both. For teams automating this end to end, our post on Shopify Flow automations for cart recovery covers how to wire re-engagement triggers directly to the checkout steps your heatmaps flag.
What I'd Check First After Reading a Heatmap
Start with mobile versus desktop overlays on your three highest-revenue pages, since that's where the biggest gaps usually hide. Fix one high-impact tappability or CTA issue and watch revenue per session, not just clicks. Then pair that fix with a re-engagement push aimed at the exact step where shoppers dropped off.
— Lucas
How StorePush Fits Into Your Heatmap-Led Fixes
Fixing the friction your heatmaps expose gets you part of the way. The other part is the shoppers who leave before your fix even ships, and that's the majority of your traffic on any given day. StorePush is built specifically for that gap: it re-engages visitors who abandon cart or browse without ever needing their email or phone number, using native Apple App Clips that land directly on a shopper's lock screen with zero app install required.

Combine that with the prioritized fixes your heatmap data points to, and you're addressing both sides of the abandonment problem at once instead of picking one. StorePush offers a free plan to start with paid Pro tiers as you scale, plus a usage commission on recovered revenue, so the cost tracks the results. If you're ready to see what lock-screen recovery does for the visitors your checkout heatmap just flagged, check out StorePush and start a trial.
Sources
- Introducing conversion heatmap: the ultimate tool for e-commerce optimization | Microsoft Clarity
- Pixel privacy | Shopify Developers
- Shopify CRO practitioner notes | Clyro
FAQ
What Is a CTR Heatmap on Shopify?
A CTR heatmap shows the click-through rate of specific elements on a page, revealing which buttons, images, or links get engagement. On Shopify, the most useful version ties those clicks to actual purchases through a conversion overlay rather than raw click counts alone.
What's the Difference Between a Click Map and a Conversion Heatmap?
A click map shows where shoppers tap or click, useful for spotting broken UI or dead clicks. A conversion heatmap goes further and shows what percentage of sessions that clicked an element ended in a sale, which is the metric that actually matters for revenue.
How Many Sessions Do I Need Before Trusting a Heatmap?
Give a page a few hundred sessions minimum before drawing conclusions, and treat anything on a low-traffic page with caution. For A/B tests specifically, sequential testing works better than fixed-sample A/B tests once you're under roughly 1,000 sessions per week per variant.
Can Heatmap Data Work With Shopify's Privacy Requirements?
Yes, when implemented through Shopify's own Web Pixels framework. Pixels subscribe to visitorConsentCollected and only fire when declared privacy permissions match the visitor's actual consent choice.
Does StorePush Replace a Heatmap Tool?
No, StorePush complements heatmap tools rather than replacing them. Heatmaps tell you where shoppers hesitate or abandon, and StorePush re-engages those specific abandoning visitors through lock-screen push notifications without needing their email or phone number, with plans starting on a free tier.