Push notification delivery rate is the percentage of sent messages that a push service actually accepts and passes toward a device: (delivered ÷ sent) × 100. For a mixed, real-world audience, expect delivery rates in the mid-range to high range overall, with fresh, engaged Android and iOS segments climbing higher.
TL;DR:
- Delivery rates for high-engagement Android and iOS segments can reach up to 97%, but generally drop by 20 to 25 points for mixed or dormant audiences due to token issues and permissions.
- "Delivered" status indicates the message was accepted by the platform but does not confirm actual receipt or display on the device.
- Stale tokens, device power management, user permission changes, and payload size are common causes of delivery delays or undelivered messages.
- Regular token pruning, proper priority flag use, and payload optimization are key steps to rapidly improve push notification delivery rates.
- Accurate measurement requires tracking sent, delivered, confirmed receipt, clicks, and errors to identify and address specific failure points effectively.
Table of Contents
- How Do You Calculate Push Notification Delivery Rate?
- Why Doesn't "Delivered" Mean the Notification Arrived?
- What Delivery Rate Should You Expect by Platform?
- Why Do Push Notifications Go Undelivered or Arrive Late?
- How Do You Measure Delivery Rate Correctly?
- What's the Fastest Way to Improve Delivery Rates?
- How Do You Debug a Sudden Delivery Drop?
- Prioritizing Fixes When You're Improving Delivery at Scale
- Recover More Carts Without Chasing Emails or Phone Numbers
- Sources
- FAQ
How Do You Calculate Push Notification Delivery Rate?
The formula itself is simple: Delivery Rate = (Delivered ÷ Sent) × 100. The complexity hides in what each provider counts as "Delivered," and that's where most teams get their reporting wrong.
"Sent" is every message your server successfully handed to Firebase Cloud Messaging (FCM) or the Apple Push Notification service (APNs) for processing. "Delivered" is the subset those services accepted and attempted to route toward a device. Some dashboards then split that into Delivered (raw count, can include duplicates from retries) and Delivered Unique (deduplicated by device or token), and Pushwoosh's own statistics documentation flags this distinction as a common source of confusion when teams compare numbers across campaigns.
A few things routinely skew the math:
- Batching across multiple sends of the same campaign can inflate "Sent" if you're not tracking unique recipients.
- Duplicate tokens from users who reinstalled an app or re-subscribed to web push double count the same person.
- Segmentation overlap (a user in two audience lists) triggers two sends and can make your delivery rate look worse than your actual reach.
Standardize on Delivered Unique divided by unique Sent, and your week-over-week numbers will finally mean something.
Why Doesn't "Delivered" Mean the Notification Arrived?
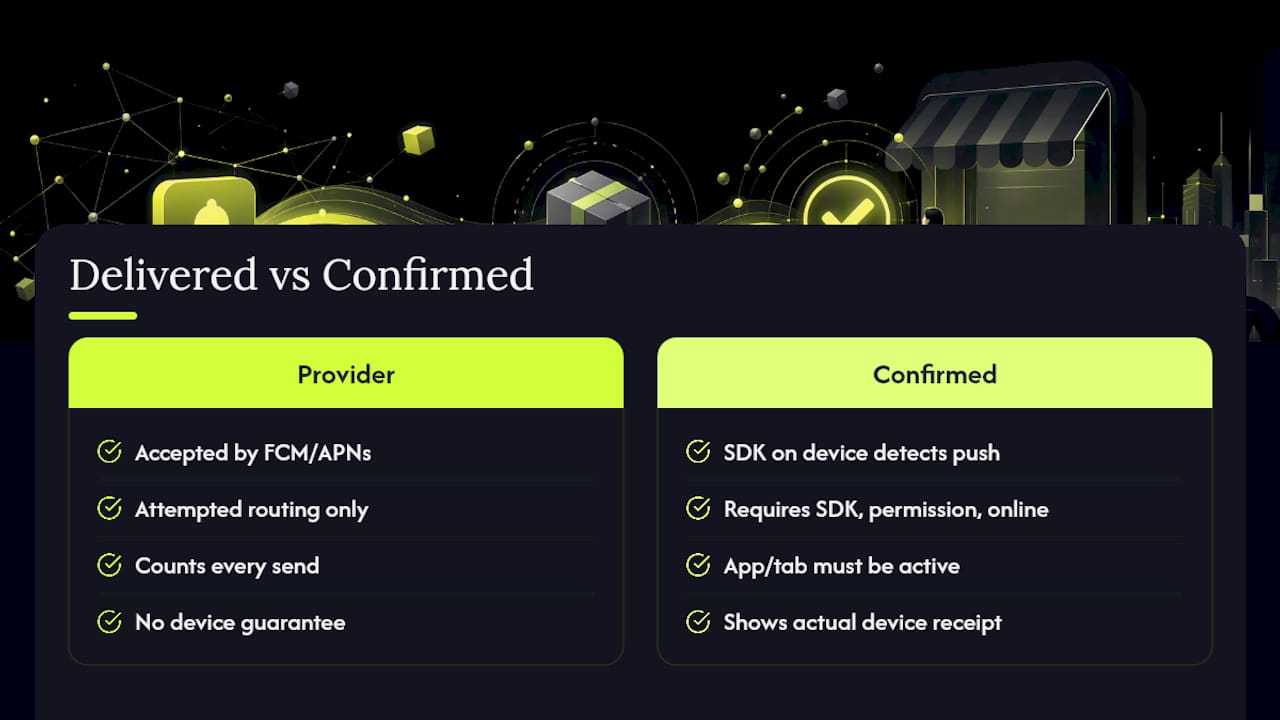
Here's the part that trips up even experienced marketers: a "delivered" status from FCM or APNs means the push service accepted your message and attempted to route it. It does not mean the device received it, displayed it, or that the phone was even online.
Confirmed receipt is a different signal entirely. It requires your SDK to run on the device, detect the incoming push, and fire a callback to your server acknowledging it arrived. OneSignal's documentation on push notification message reports draws this line explicitly: provider acceptance and device-level confirmation are separate metrics, and conflating them overstates how many people you actually reached.
The trade-off is coverage versus accuracy. Provider-delivered numbers come from every send, no extra work required. Confirmed receipt only comes from devices where your SDK is installed, has notification permission, and happens to be online at the moment the push arrives. A phone in Doze mode, an app the user force-closed, or a web browser tab that's been unloaded from memory will never fire that callback, even though the provider marked the message "delivered." You'll always see a gap between the two numbers, and that gap is the real story.
Pro Tip: Don't panic if your confirmed receipt rate sits 15 to 25 points below your provider-delivered rate. That gap is normal. Panic if the gap suddenly widens week over week, since that usually points to a token hygiene or permission problem, not bad luck.
What Delivery Rate Should You Expect by Platform?
Platform matters more than most dashboards let on. Android and iOS handle background processes, battery optimization, and permission prompts differently, and those differences show up directly in your numbers.
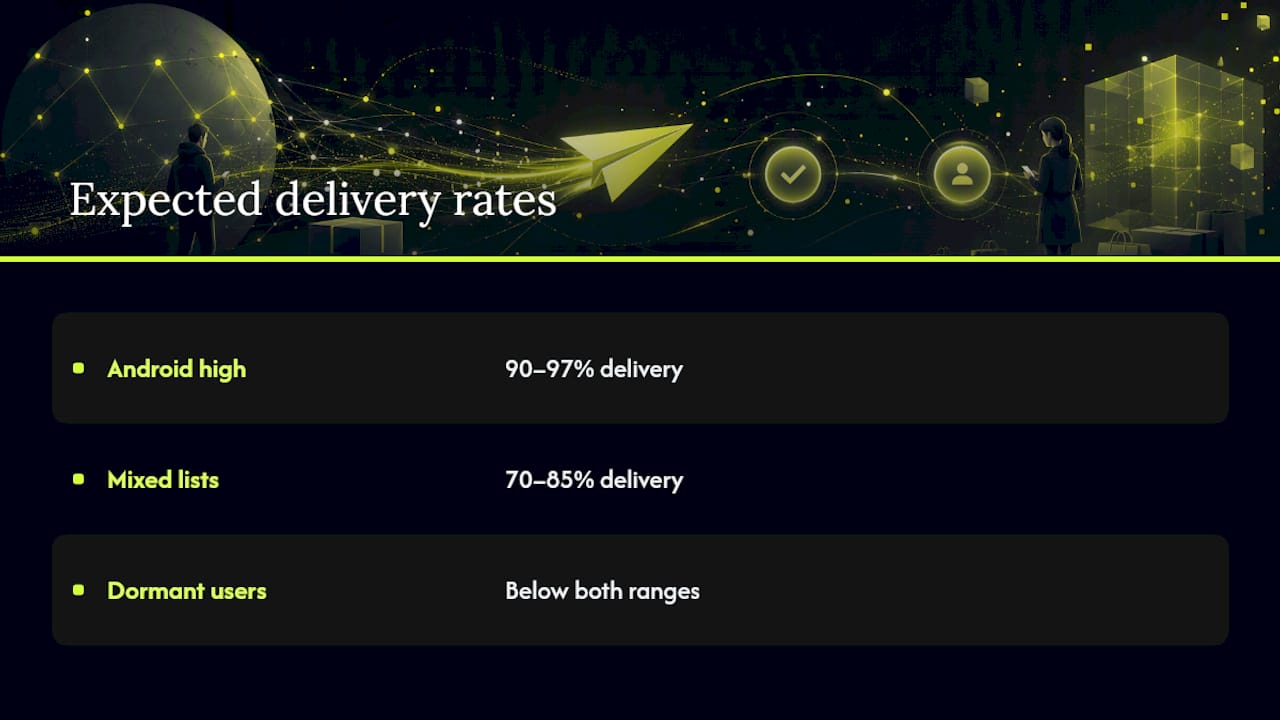
Benchmarks compiled from Firebase documentation and industry delivery-rate reporting put Android at 90% to 97% delivery for high-engagement lists, dropping to 70% to 85% for mixed audiences. Dormant segments on either platform, meaning users who haven't opened the app in 60+ days, routinely fall below both ranges.
By the Numbers: High-engagement Android audiences can hit 97% delivery. Mixed, unfiltered lists on either platform often land 20 to 25 points lower, mostly because of stale tokens and disabled permissions rather than provider failure.
Opt-in rates change the equation before delivery even starts. Modern Android versions (13 and later) have moved closer to that same explicit opt-in model, narrowing what used to be an Android advantage.
Web push carries its own quirks. Browser permission behavior varies by vendor, and Safari's handling of web push on iOS has historically lagged behind Chrome and Firefox, with limited support until relatively recent iOS versions. If your audience skews mobile Safari, don't benchmark your web push numbers against Android Chrome. You're comparing two different ecosystems.
Why Do Push Notifications Go Undelivered or Arrive Late?
Most delivery problems trace back to one of four categories: stale tokens, device power management, user-side permission changes, or provider-side throttling. Work through them in this order when you're troubleshooting a drop.
- Stale or expired tokens. FCM tokens can go inactive after roughly 270 days without app activity, and sending to one returns an UNREGISTERED response. If you're not checking for that error code, you keep sending to dead addresses and your delivery rate absorbs the hit silently.
- Device power management. Android's Doze mode, various manufacturers' aggressive battery optimization layers, and iOS Low Power Mode all delay or suppress background delivery. A message marked "delivered" by the provider can sit queued on the carrier or OS level for minutes or hours.
- Disabled notification channels. Users can mute a specific notification category without revoking full app permission. Your provider still reports "delivered." The device just won't display it.
- User-side revocation. Denied permissions, cleared browser site data for web push, or an outright app uninstall all silence future sends, and none of these show up cleanly until you cross-reference error codes.
- Payload and priority issues. Oversized payloads, missing priority flags, or hitting provider rate limits during a large campaign burst can cause drops or delays, particularly on memory-constrained devices.
How Do You Measure Delivery Rate Correctly?
Real measurement means tracking five numbers, not one: Sent, Delivered (provider-reported), Confirmed Receipt (SDK-reported), Clicks, and Errors. Most teams only watch the first two, then wonder why their "great" delivery rate doesn't translate into revenue.
Token hygiene is the unglamorous work that makes everything else accurate. A practical policy looks like this:
- Restrict active-subscriber reporting to tokens used within the last 90 days.
- Run a daily or weekly batch job to prune anything older or flagged UNREGISTERED.
- Parse every provider batch response for error codes instead of only checking the success count.
- Feed pruning results back into your audience size so campaign math reflects who you can actually reach.
Skipping this step inflates your reported audience by 20% to 40%, since dead tokens sit in your database looking like live subscribers until a send fails against them.
Provider dashboards already give you the raw materials. Pushwoosh's statistics interface exposes SENT, DELIVERED UNIQUE, OPENED, and ERRORS with platform breakdowns, which is enough to classify most failures without custom tooling. For deeper diagnosis, OneSignal's message reports separate Delivered, Confirmed, Remaining, and Failed into distinct buckets. Build a simple internal dashboard on top of these fields and set an alert threshold: if delivery rate drops more than 10 points from your trailing 7-day average, that's a signal worth investigating same day, not at the end of the month. For a deeper breakdown of which formulas to track and how to wire up SDK confirmation, see this push notification analytics guide.
What's the Fastest Way to Improve Delivery Rates?
Fixing delivery rate is mostly disciplined maintenance, not clever engineering. Work through these in priority order.
- Prune and validate tokens on a schedule. Automate UNREGISTERED handling so dead tokens get removed within a day of the error, not a quarter.
- Set correct priority flags. Use high priority sparingly and only for time-sensitive messages (cart recovery, price drops, shipping alerts). Overusing it trains OEM battery optimizers to throttle your app specifically.
- Keep payloads under roughly 1 KB. Large payloads approaching FCM's 4,096-byte limit are more likely to get dropped on low-memory devices. Fetch rich media (images, GIFs) inside the app after the tap instead of stuffing it into the payload. Watch your character counts too, since bloated copy often correlates with bloated payloads. This character limit cheat sheet is worth bookmarking.
- Rethink your permission prompt timing. A contextual ask, triggered after a user adds something to a cart rather than the moment they land on your site, converts better and produces a healthier long-term subscriber base. Strategies for raising opt-in rates on iOS and Android apply directly here, since a higher opt-in rate expands your addressable audience before delivery math even enters the picture.
- Build retry logic with backoff, not brute force. Re-sending immediately to a failed token wastes quota and can trigger provider-side throttling. Queue retries with increasing delay and stop after two or three attempts per token.
- Schedule around local time and engagement windows, not your own office hours. A push sent at 3 a.m. local time to a dormant user is dead weight before it even leaves your server.
- Segment your active users first. Send to engaged tokens (opened or clicked in the last 30 days) as your primary campaign, then run re-engagement flows separately and sparingly to dormant segments. Mixing them muddies your delivery rate and your open rate alike. If you want the re-engagement layer to actually convert instead of getting muted, personalization tactics that recover revenue are worth building into that flow.
Pro Tip: If you only have bandwidth to fix one thing this month, fix token pruning. It's the least exciting item on this list and the one that moves your numbers the most, because every other fix is wasted effort if half your "audience" is already gone.
How Do You Debug a Sudden Delivery Drop?
When delivery rate falls off a cliff, don't guess. Pull the error codes first.
- UNREGISTERED means the token is dead, usually from an uninstall or an app data wipe. Prune it immediately; don't retry.
- INVALID_ARGUMENT usually points to a malformed payload, often an oversized field or a bad priority value. Check what changed in your last deploy.
- A gap between provider-delivered and confirmed-receipt without matching error codes usually means devices were offline or your SDK callback isn't firing. That's a code issue, not a token issue; check your SDK version and permission state separately.
To reproduce a drop in staging, test with a deliberately stale token, then a fresh one, then swap priority flags between normal and high. That three-way comparison isolates whether the problem is token age, payload structure, or provider throttling.
Before contacting FCM or APNs support, collect a diagnostic bundle: a sample of failed message IDs, the exact error codes returned, timestamps, target OS versions, and your payload size for the affected batch. Support teams move faster with specifics than with "our notifications stopped working."
Prioritizing Fixes When You're Improving Delivery at Scale
If you're staring at a delivery rate problem with limited engineering time, the order matters more than the individual fixes. Instrumentation and token hygiene come first, always. You can't fix what you can't accurately measure, and a bloated token list will make every other change look less effective than it actually is.
Permission UX comes second, because it changes the size of your addressable audience before any technical optimization matters. Payload and scheduling tweaks come last. They matter, but they're squeezing marginal gains out of an audience you've already correctly sized and reached.
The trade-offs are real, not theoretical. Aggressive token pruning improves accuracy but shrinks your reported reach, which can spook a stakeholder looking at a dashboard without context. High-priority flags improve speed but get throttled by OEMs and drain battery if overused, and providers notice patterns of abuse. There's no version of this where you get maximum reach, maximum speed, and maximum accuracy simultaneously. Pick your trade-off deliberately instead of by accident.
— Lucas
Recover More Carts Without Chasing Emails or Phone Numbers
Everything above assumes you already have an email or a phone number to push a notification against, and that's the trap. Most cart abandonment tools, and most of this article's advice, depend on data collection you never get from the 90%-plus of visitors who leave without buying anything.
Some push notification services send notifications directly to a shopper's lock screen using native Apple App Clips, with no email, no phone number, and no app install required. That means the delivery and permission challenges covered here apply to an audience many stores currently can't reach. These services often integrate with major e-commerce platforms and include dashboard analytics that show revenue attribution and CTR by campaign so you can track recovered carts.
If your checkout flow is already losing carts and you've never had a way to follow up without an email address, start with the Free plan at StorePush and see what shows up in your funnel this week.
Sources
- Push Notification message reports — OneSignal Documentation
- Push Notification Delivery Rate Estimator 2026 | Mobile Squad
FAQ
What Is a Good Delivery Rate for Push Notifications?
A good delivery rate for a mixed, real-world audience falls between 60% and 85%, while high-engagement Android segments achieve delivery rates near the upper 90% range and iOS segments show similarly strong delivery rates. Dormant lists with old tokens will always underperform both ranges.
What Is the Success Rate of Push Notifications?
"Success" depends on whether you mean delivery or engagement. Provider-delivered rates typically land in the 70% to 85% range for mixed audiences, but 100% delivery is considered unattainable in real-world conditions because of device states and user behavior outside your control.
What Is a Good Click-Through Rate for Push Notifications?
Click-through rate varies widely by industry and segment quality, and there's no single universal benchmark. Focus on comparing your own campaigns over time and against your confirmed-receipt base, since comparing clicks against inflated "sent" numbers will always understate your real performance.
How Much Does It Cost to Send a Push Notification?
Cost depends entirely on the platform or provider you use, ranging from free tiers with volume limits to paid plans with per-message or subscription pricing. StorePush offers a Free plan and a Pro plan at $50 per month, plus a 5% usage commission on revenue its push notifications recover.
What Is a Good Delivery Rate for Email, and How Does It Compare to Push?
That said, push notifications often outperform email on actual revenue recovered even though their raw delivery rate can be lower.